1x on DP: Lay odds on the don’t pass (DP) bet to win 1x (lay $12 on 6/8 points, $15 on the 5/9 points, and $20 on the 4/10 points)
Note that not all casinos will allow you to play this strategy, but at least some of them will. Those that allow it may not rate your play on the pass line and don’t pass—your mileage may vary.
Simulated outcomes
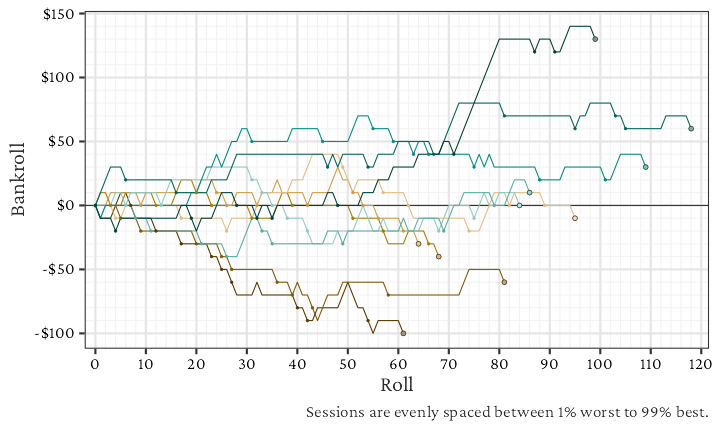
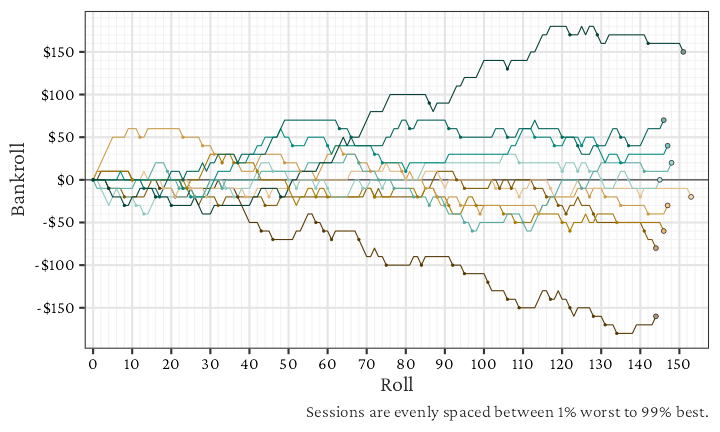
To understand how the strategy could perform on any given day, we simulate 1,000,000 sessions for each of three session types: one shooter, 10 shooters, and one hour (144 rolls, letting active bets finish). The results are given in each tab below. For more information on how to read each chart, table, or statistic, see How to interpret statistics from The Craps Analyst.
Analysis
The Doey Don’t strategy takes advantage of the nearly opposite wins and losses between the pass line and don’t pass bets. Except on a 12, if one bet wins, the other loses and vice versa. On a 12, the don’t pass pushes (“bar 12”) and the pass line loses. The important question is whether that feature makes it a good strategy or not.
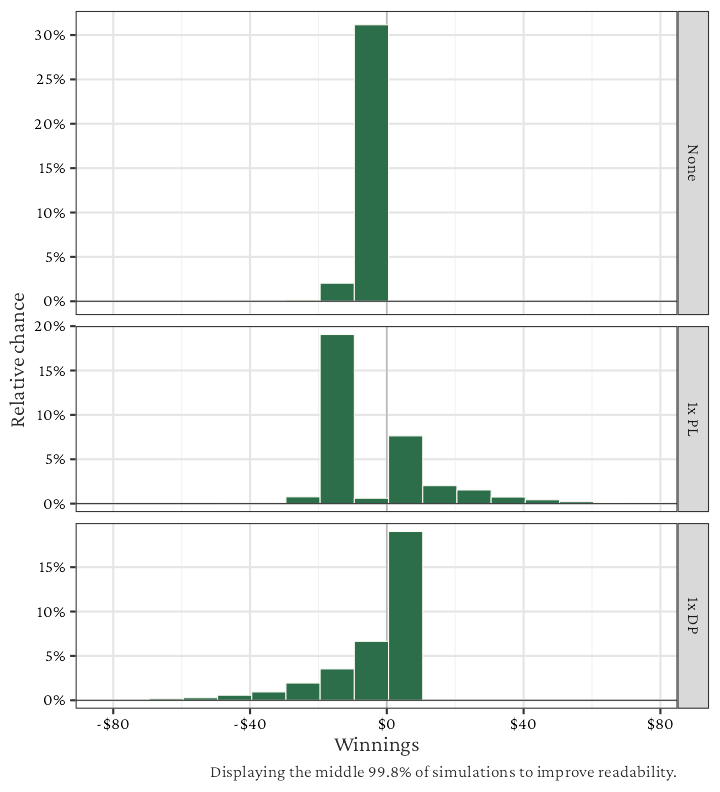
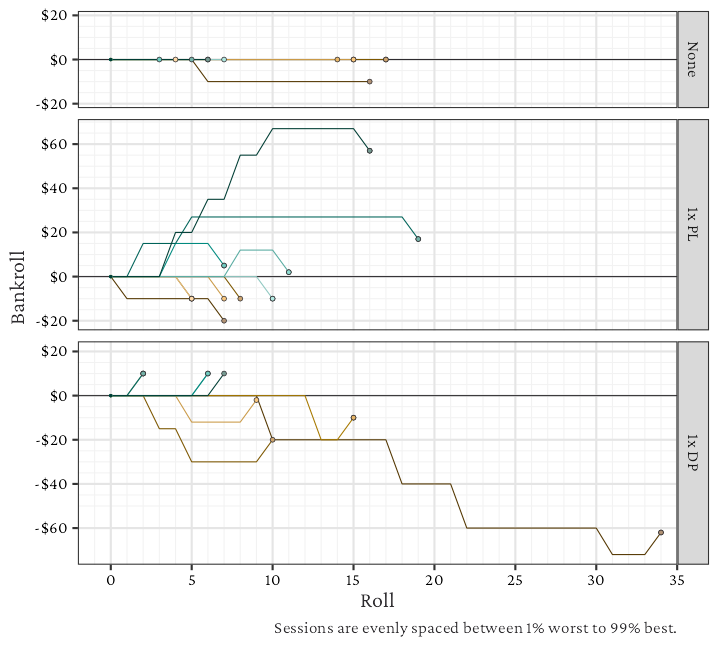
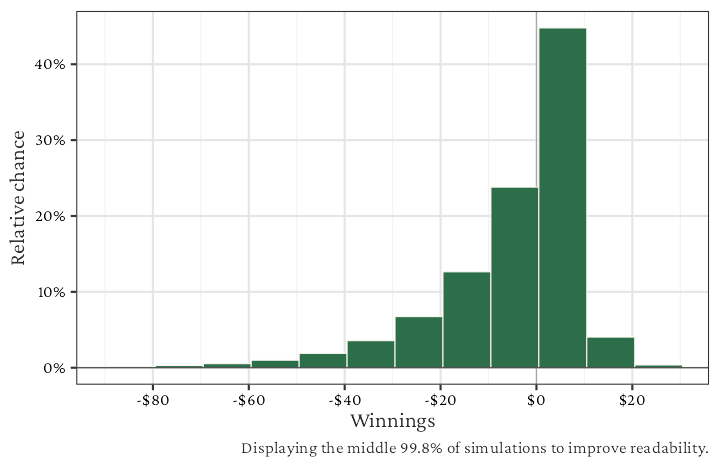
The Doey Don’t without odds is a terrible strategy. The sample sessions and quantiles show that it’s impossible to win money, because all of the wins cancel each other out. The losses are slow, and most end up in a complete wash, but in longer sessions you start to see the bottom 1% and 25% of sessions with a loss. If the best case scenario (top 1%) is $0 in winnings, it can’t be a good strategy. (Note that the win chance metric includes half of the ties, so it looks higher than anticipated).
What happens when we add odds? Just as with the Pass Line with Odds or Don’t Pass with Odds strategies, adding odds acts as free variance—it does not change the average winnings, but it does increase the variability. This means that both odds on the pass line and don’t pass bets end up with decent win chances (40% for 1x on PL, 49.3% for 1x on DP per-10-shooters). Comparing the Doey Don’t with 1x on PL to just a pass line bet with 1x odds, the Doey Don’t approach has higher average loss ($6.99 vs $3.53 per-10-shooters), lower best-case winnings (Best 1% quantile of $132 vs $260 per-10-shooters), lower worst-case losses (Worst 1% quantile of -$98 vs -$176), and lower win chance (40.0% vs 44.1% per-10-shooters). These trends also hold when comparing to the dark side odds approach. If your bankroll is small, the Doey Don’t can be a way to bring down the variance to keep you on the table longer. But if your bankroll is large or you plan on placing large odds bets (2x or more), you’re likely better off not hedging and sticking with either a Pass Line with Odds or a Don’t Pass with Odds strategy, perhaps with lower odds if needed.
This strategy is a great example that adding two strategies together always results in their average winnings adding together. If you compare the average winnings per-10-shooters with no odds, the loss of $7.02 exactly equals $3.56 (from Pass Line) + $3.46 (from Don’t Pass). This is true for all strategies as long as the session type is consistent. This principle is also true for house edge in percentage terms, as long as the bets have the same resolutions. The house edge for a pass line bet is 1.41% and for a don’t pass bet is 1.36%. Combined, this equals 2.77%, which you may note is exactly the same as 1/36. It’s no coincidence that across both bets, all possible dice rolls are a tie except the 12, which results in PL losing and DP pushing, or a loss of 1 unit across 36 possible dice outcomes.
With any hedging approach, it can feel like you’re eliminating chances to lose. But as the Doey Don’t strategy shows, you’re also eliminating chances to win, and combined with an overall higher house edge, it makes winnings over the short term even more difficult.
A Don’t Pass strategy with odds laid behind. Bet the don’t pass for $10. When the point is set, lay odds behind it for the following amounts:
Lay odds to win 1x ($10), which is a $12 lay bet on the 6/8, $15 on the 5/9, or $20 on the 4/10
Lay odds to win 2x ($20), which is a $24 lay bet on the 6/8, $30 on the 5/9, or $40 on the 4/10
Lay odds to win 345x, which is a $60 lay for each number
Lay odds to win 10x ($100), which is a $120 lay bet on the 6/8, $150 on the 5/9, or $200 on the 4/10
Note that most casinos that offer a maximum of 345x odds on the pass line will allow you to lay $60 odds on the don’t pass to win the equivalent 345x, but fewer will offer the opportunity to win 10x odds.
Simulated outcomes
To understand how the strategy could perform on any given day, we simulate 1,000,000 sessions for each of three session types: one shooter, 10 shooters, and one hour (144 rolls, letting active bets finish). The results are given in each tab below. For more information on how to read each chart, table, or statistic, see How to interpret statistics from The Craps Analyst.
Analysis
Just as the Don’t Pass mirrors the Pass Line strategy, the outcomes for this strategy mirror the Pass Line with Odds strategy in many ways. The resulting winnings are nearly inverted, this time favoring small wins per-shooter or per-10-shooter with the possibility of huge losses (when you keep replacing the don’t pass bet every time the shooter hits a point). The only difference is when a 12 rolls on the come-out, in which the don’t pass bet pushes and the pass line bet loses. (Side note: if you take the house edge of 1.41% for pass line and 1.36% for don’t pass, add them up to get 2.77%, which is exactly the chance of rolling a 12, i.e. 1 out of 36).
Just like with the Pass Line with Odds strategy, 1) the average winnings are nearly identical no matter how much odds you take and 2) the variability increases if you take more odds. Laying odds, a 0% house edge bet by itself, acts as “free variance.” It allows you to tune your strategy to match your own risk preferences, without needing to add other bets that would otherwise decrease your average winnings, which is a very nice feature. Just beware that even a small amount of odds can push your resulting winnings to a very wide distribution, which can be a problem if you have limited bankroll or are playing at tables with higher minimums.
The interesting piece of this strategy is that if you budget per-shooter, the win chance is above 50%. I discuss this phenomenon at length in One Surprising Feature of Dark Side Betting, but essentially because the don’t pass bet is favored to win once you get past the come-out, and you win on the odds bet which is at least as much as the initial don’t pass amount, you end up with many potential small wins that drive the win chance up. The more shooters you play across, the further this will drop, before it eventually drops below 50% (somewhere about 70-80 shooters). Note that unless you have very large odds multipliers, playing your sessions on a per-time basis still has a win chance below 50%, which is more indicative of a slightly negative average winnings. Ultimately, you can’t escape the house edge if you play long enough.
If you like to play the dark side and aren’t bothered by a strategy with minimal betting (i.e. you don’t get bored waiting for the point to win or lose), then Don’t Pass with Odds offers some great potential returns with minimal average loss over time.
A Pass Line strategy with an odds multiplier. Bet the pass line for $10. When a point is set, put odds behind it for the following multipliers:
1x odds
2x odds
345x odds (3x odds of 6/8, 4x odds on 5/9, 5x odds on 4/10)
10x odds
For a detailed explanation of the pass line bet, see All Bets Are Off: Re-learning the Pass Line Bet in Craps. The 345x odds is a common maximum odds for many casinos, but some offer up to 10x (or even 100x), so that strategy is also shown.
Simulated outcomes
To understand how the strategy could perform on any given day, we simulate 1,000,000 sessions for each of three session types: one shooter, 10 shooters, and one hour (144 rolls, letting active bets finish). The results are given in each tab below. For more information on how to read each chart, table, or statistic, see How to interpret statistics from The Craps Analyst.
Unlike most other strategy pages, the tables and plots show variations of the strategy depending on how much odds are taken behind. This allows for easy comparison and hopefully can help you select the right amount of odds for your bankroll. Note that the plots do not show the 10x odds multiplier because the range is huge and it makes things challenging to compare.
Analysis
One important aspect of the odds bet is that is the only bet in the casino that carries 0% house edge. The casino pays out true odds depending on what the point is—so if the point was 6, the odds of winning are 5:6 and the casino pays out 6:5. What’s the catch? You can only bet odds with a pass line bet down, which has a 1.41% house edge (or don’t pass, but that’s another page). Note that the simulated average winnings is nearly identical to that of the Pass Line bet alone (-$0.36 per shooter, -$3.56 per 10 shooters, -$6.18 per hour), as we would expect. There is some slight differences which are due to simulating only one million sessions instead of an infinite number, especially for large odds multiples which increases the variability. In theoretical terms, the average winnings is the same no matter how much odds you take.
The unsurprising difference when taking higher odds is that the variability increases. This can be seen from the strategy metrics on any session type and in the plots. Variance is typically a good thing in the casino, as long as your bankroll can sustain the losses. (With no variance and a –EV bet you’re guaranteed to lose). Note that even 2x odds on a $10 table, with no other bets, could see swings from -$136 to $120 in the middle 50% of sessions and a whopping -$434 to $444 in the middle 99% of sessions. If you happen to be at a $25 minimum table, those swings would be 2.5x that. The swings can work with a large bankroll, but not with a small bankroll because your win chance increases slightly if you can last for 10-30 shooters (note, this is slightly counterintuitive, but can be seen here with a ~40% win chance on one shooter and a ~45% win chance on ten shooters; the full trend is shown in One Surprising Feature of Dark Side Betting).
Given these insights, I take some issue with message I often hear that “adding odds lowers your house edge.” The argument goes something like this: adding an odds bet (0% edge) to the pass line (1.41% edge) makes the average edge lower than 1.41%. But in real dollar terms, this only means that a $10 pass line with $10 in odds has lower edge than a $20 pass line bet. It does not mean that a $10 pass line with $10 in odds has lower edge than a $10 pass line bet alone—their theoretical loss (theo in casino-speak) is identical. Unfortunately, we can’t just average house edge percentages together because the bet amounts and bet timing matters. And you can’t win or lose percentages at a casino, you can only win or lose dollars. End of rant.
Instead, I like to view the odds bet as “free variance” in the casino. Adding odds doesn’t change your average winnings, but it will increase variability. It’s a great way to tune your strategy to match your own risk preferences, without needing to add other bets that would otherwise decrease your average winnings.
This strategy combines a Doey Don’t strategy, odds on the don’t pass, and place bets that stay up for only a few wins, in what ends up being a heavily hedged approach:
$10 pass line bet
$10 don’t pass bet,
Add (lay) $60 in odds once point is established
A phased place bet approach (no matter what the point is):
Start with $24 place bet each on 6 and 8
If one of these bets wins, shift to $44 inside (place the 5, 6, 8, and 9)
If one of the inside bets wins, take all place bets down
The origins of this strategy is somewhat unknown. From some digging, it may have first appeared on gamblersbookcase.com, but it no longer appears there. Since then, some other sites have picked it up. The strategy description here comes from bestcrapsstrategy.net, which originally inspired this blog post: 5 Systems to Try at the Craps Table. The simulations have been re-worked for this page.
Simulated outcomes
To understand how the strategy could perform on any given day, we simulate 1,000,000 sessions for each of three session types: one shooter, 10 shooters, and one hour (144 rolls, letting active bets finish). The results are given in each tab below. For more information on how to read each chart, table, or statistic, see How to interpret statistics from The Craps Analyst.
Analysis
There’s a lot going on in this strategy, and before looking at the numbers, it helps to break down some of the strategy aspects:
Before a point is set, most rolls will be net $0 for the player because both the pass line and don’t pass are bet. The only exception is on a roll of 12, where the player loses $10 on pass line and pushes on the don’t pass.
When the place bets are active (either 6/8 or 5/6/8/9), the total outlay for them is either $48 or $44. The don’t pass odds can win either $30 (on 4/10), $45 (on 5/9), or $50 (on 6/8). So a seven-out in this case is heavily hedged, and will typically be a very small win or loss.
The best situation is that two place bets win ($28 win on the 6/8, then a $14 win on the 5/6/8/9, for a total of $42 win), and then the shooter sevens-out for a win on the don’t pass odds.
The worst situation is that the shooter hits a lot of point numbers, which will lose $60 per point. Some losses are offset by early place bet wins (especially if the point is one of those place numbers), but once two bets win on the shooter, we no longer make the place bets and will net lose $60 per point.
These situations show up when looking at the results per-shooter. The best win is $92, but wins in the $80-$92 range happen about 15% of the time. The most common outcome is a small win or loss (-$20 to $40). While less common overall, the bigger losses can be huge, with the worst 1% being a $208 loss. As with most dark-side strategies, the win chance for one shooter is above 50%, at 56.8%.
In longer sessions (per-10-shooter or per-hour), the outcomes become more “normal” or bell-shaped. The negative skew still appears on a per-10-shooter basis, but the win chance decreases to 49.6%.
Hedging will result in (1) increased house edge and (2) lower variability than making the bets separately. To point (1), the average loss per-10-shooter here is $15.15 or 4.4x that of the Don’t Pass strategy. Yet the variability of $181.42 is less than the total variability we would get when using the pass line, don’t pass, and some place bets combined.
Overall, the strategy is interesting but carries a high house edge and the potential for big losses. The best case scenario are medium-length rolls that end in a seven-out. But the player may have to weather a hot table where most of the other players are winning big while they continue to lose their $60 odds bets.
A strategy designed to win on any roll that’s not a seven, once a point is established:
Bet the pass line for $10
Add 2x odds when the point is on
Place the 5 for $20 (two units)
Place the 6 and 8 for $24 each (two units)
If the point is 5, 6, or 8, skip the place bet on that number
Bet the field for $10 (when the point is on)
Simulated outcomes
To understand how the strategy could perform on any given day, we simulate 1,000,000 sessions for each of three session types: one shooter, 10 shooters, and one hour (144 rolls, letting active bets finish). The results are given in each tab below. For more information on how to read each chart, table, or statistic, see How to interpret statistics from The Craps Analyst.
Analysis
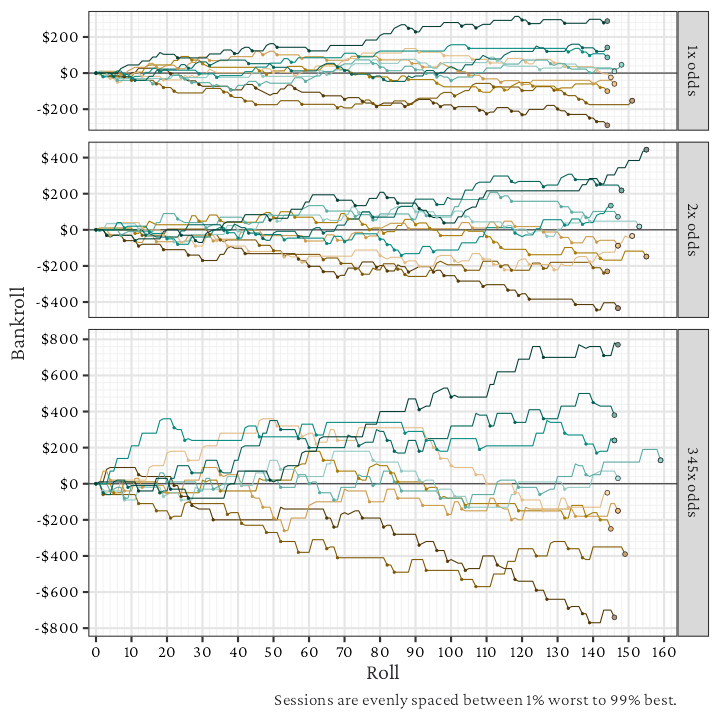
The Iron Cross is designed to win on any number that isn’t a seven (when the point is on), and we can see this behavior in the per-shooter example session lines—the bankroll increases each roll until a seven-out, at which point the player loses the full outlay (up to $108 with a $10 unit). The amount won on non-seven rolls will vary (and depends on the point set), for example a 3 or 11 rolled only wins $10 on the field, but hitting a point of 4 would win $60 ($10 pass line, $40 odds, $10 field).
Because there is a lot of betting, the average loss is very high at $5.91 per shooter, $58.42 per 10 shooters, and $101.51 per hour. For per-10-shooter sessions, this average loss is over 16x a Pass Line strategy with the same betting unit. For the same reason, there is a lot of variability compared to other strategies with only one bet.
When budgeting per-shooter, the quantiles and histogram indicate that the strategy can very likely result in moderate losses but also carry potential for huge wins. The losses are capped, but one seven wipes out the entire outlay; players are hoping for a long roll to build up the winnings before that happens. It’s also worth noting that the middle 50% of winnings (thought of as an average session in some sense) has losses much worse than the average winnings (-$36 vs -$5.91 for one shooter; -$92 vs -$58.42 for ten shooters). This typically means your average session is going to feel worse than the edge from the combined bets dictates, and overall you’re hoping for a huge win in the top 10-20% of luck or better.
Bet all of the inside place numbers (5, 6, 8, 9), with $10 on the 5/9, and $12 on the 6/8. The bets are kept active only when the point is on, and no bets are active during the come-out rolls. Total outlay is $44 per shooter. Note that each place number rolled will win $14.
Simulated outcomes
To understand how the strategy could perform on any given day, we simulate 1,000,000 sessions for each of three session types: one shooter, 10 shooters, and one hour (144 rolls, letting active bets finish). The results are given in each tab below. For more information on how to read each chart, table, or statistic, see How to interpret statistics from The Craps Analyst.
Analysis
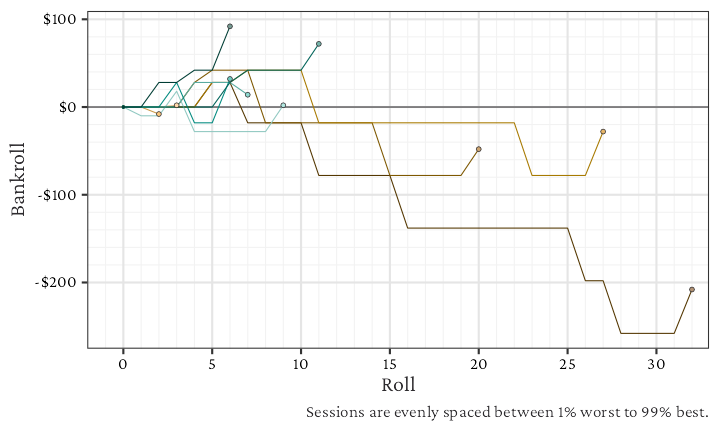
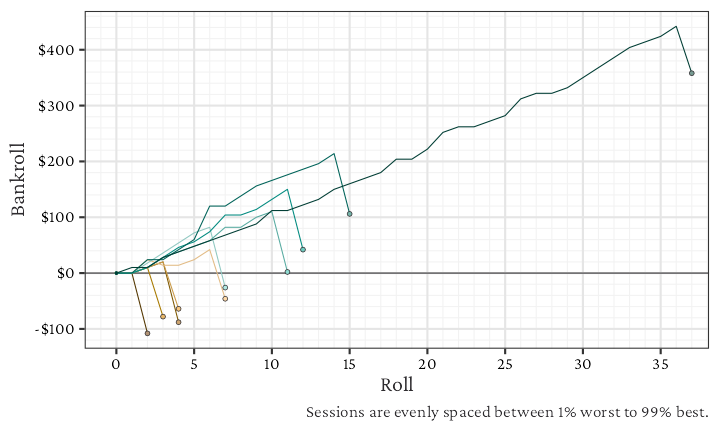
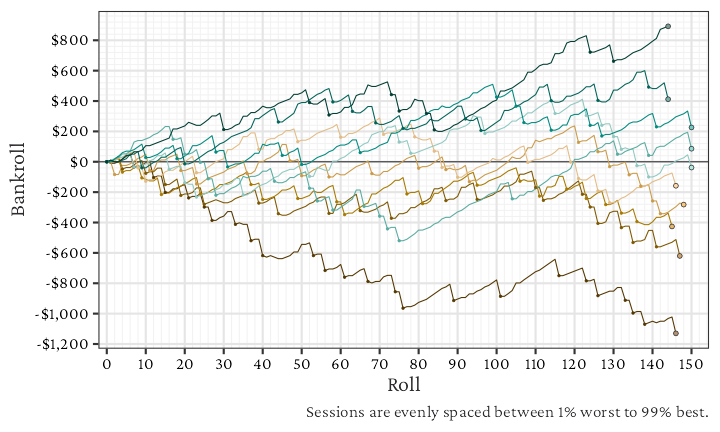
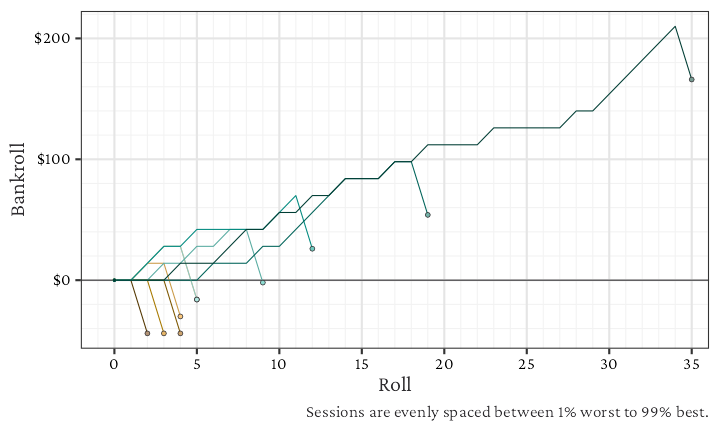
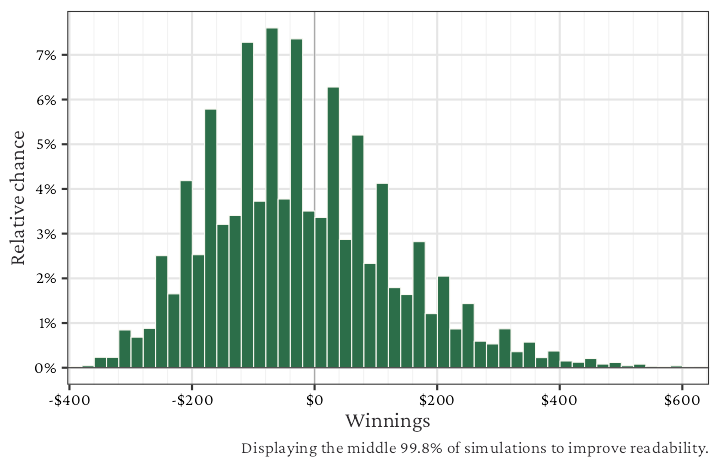
Looking at sample sessions per-shooter gives a good sense for how the strategy flows: the worst outcomes are when a quick point then seven-out happens, and the entire $44 dollar outlay is wiped out; however, when the shooter goes on a long roll, the winnings will start to offset the betting costs, and could be upwards of $166 (in the luckiest 1% of sessions). This trend continues for 10 shooter sessions, but starts to average out where the luckiest 1% of sessions would win $400 and the unluckiest 1% of sessions would lose $300—a proportionally less wide of a gap. Win chance is relatively low for one shooter (31.6%), but increases for 10 shooters (40.5%), showing a similar trend.
The strategy consists of some low house edge bets (placing 6/8, 1.52% per bet) and some medium house edge bets (placing 5/9, 4.00% per bet). All together, the average loss is about $19.79 per 10 shooters or $34.36 per hour. For reference, that’s over 5.7 times the average loss of a Pass Line strategy, and the bet’s aren’t even active for all rolls in the session.
A couple of other interesting points:
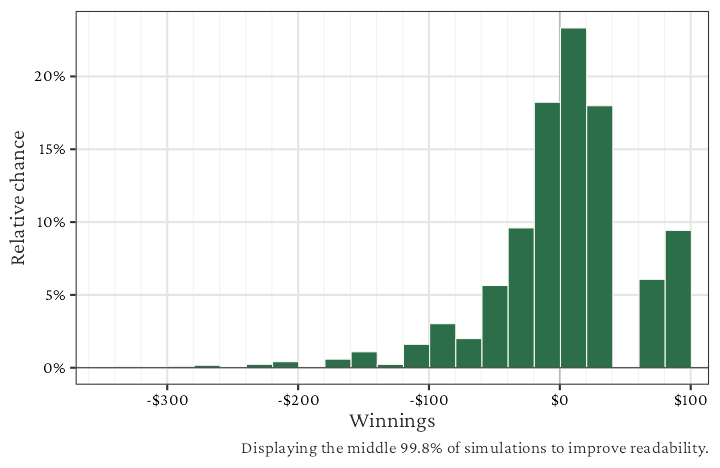
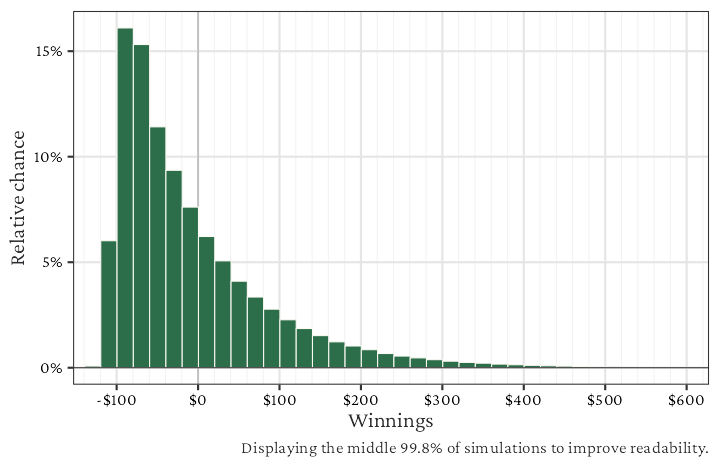
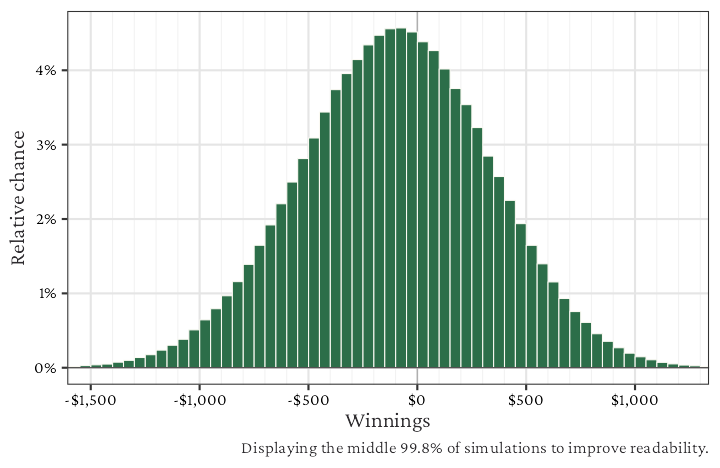
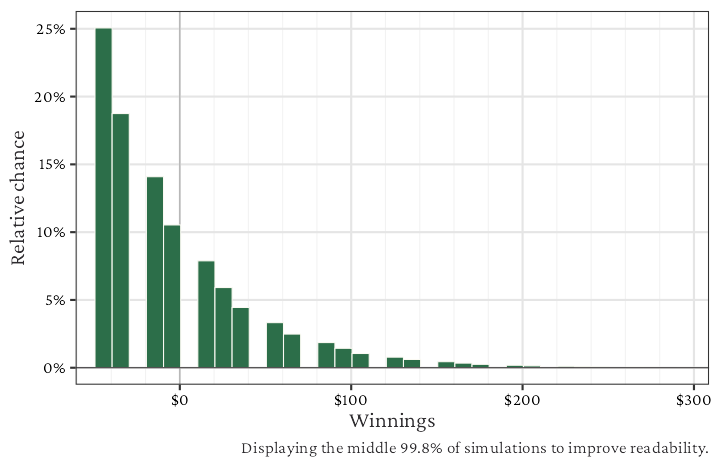
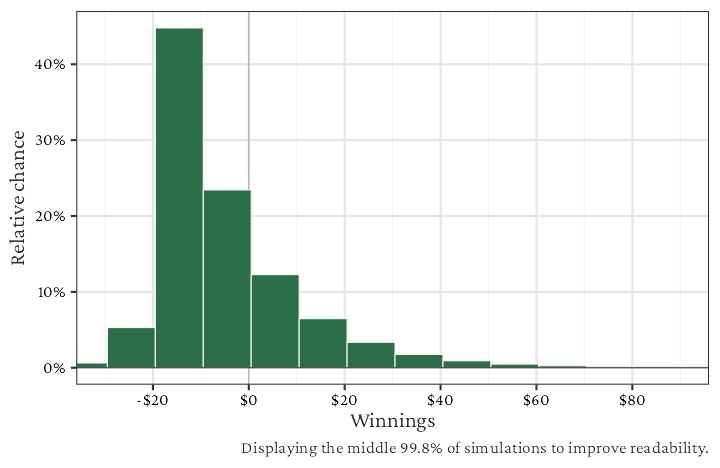
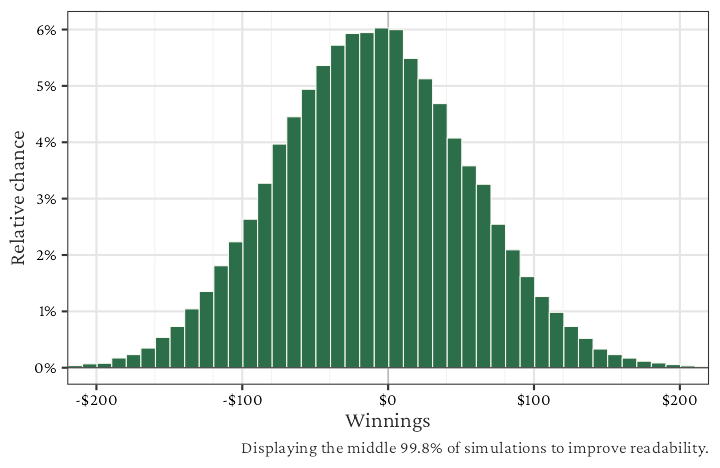
For one shooter, the chance of a seven-out before winning any bets is 25% (six ways to roll a 7, eighteen ways to roll 5, 6, 8, or 9, so the odds are 1:3, and the probability is 1 out of 4). You can see this in the histogram, where the relative chance of winnings between -$50 and -$40 is 25%, consisting only of the $44 loss when no place bets hit.
From there, the height of the bars in the histogram follow a nice descending pattern, representing a geometric distribution, i.e. the number of winning place bets before a seven-out. We can see this pattern because the place bet win ($14) is larger than the width of the bars ($10).
The restricted winning amount ($14) and fixed outlay ($44) also causes the strange bumps in the per-10-shooter and per-hour histograms—if we were to have the bar width at $1, the pattern would look much smoother.
The fundamental dark side strategy, sans odds. Bet the Don’t Pass line for $10 and replace it any time the bet is resolved. The Don’t Pass bet will win on 2 or 3, lose on 7 or 11, and push on 12 before a point is set. Any other number rolled sets the point, and the bet wins on a 7 happening before that point number rolling again. No odds are included in this page.
Simulated outcomes
To understand how the strategy could perform on any given day, we simulate 1,000,000 sessions for each of three session types: one shooter, 10 shooters, and one hour (144 rolls, letting active bets finish). The results are given in each tab below. For more information on how to read each chart, table, or statistic, see How to interpret statistics from The Craps Analyst.
Analysis
As the don’t pass bet has one of the lowest house edges, the strategy has a reasonable average loss of $0.34 per $10 unit per shooter, or about a $6.05 loss per $10 unit per hour. The average loss is one of the best for any strategy that has continuous betting, but most craps plays don’t want to play just one bet at a time.
In many ways, the Don’t Pass operates in the opposite way as the Pass Line strategy. When sessions are measured per shooter, the win rate is above 50%—it’s 61.1% per shooter or 51.3% per 10 shooters. This seems strange at first, because the don’t pass bet is not a winning bet by itself; however, the “win rate” includes half of the ties (which account for 23.8% of the per-shooter results and 8.0% of the per-10-shooter results). This phenomenon is discussed in more detail in One Surprising Feature of Dark Side Betting. However, on a per hour basis, the win rate is more reflective of the underlying house edge of the don’t pass bet, at 46.9%.
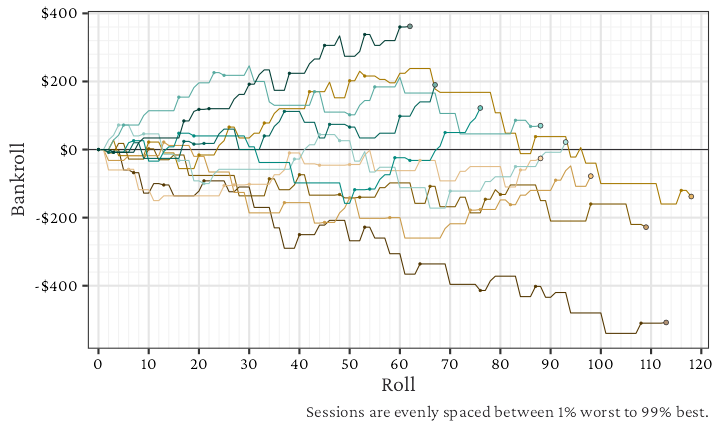
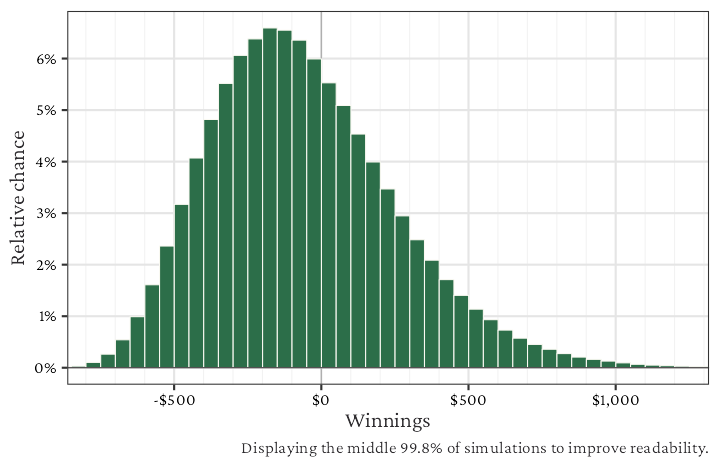
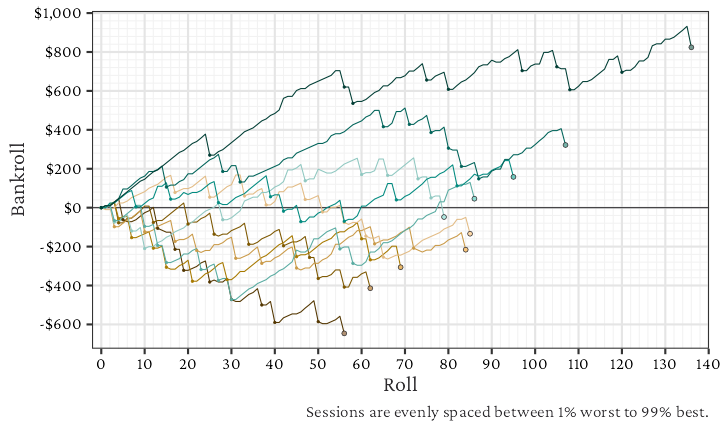
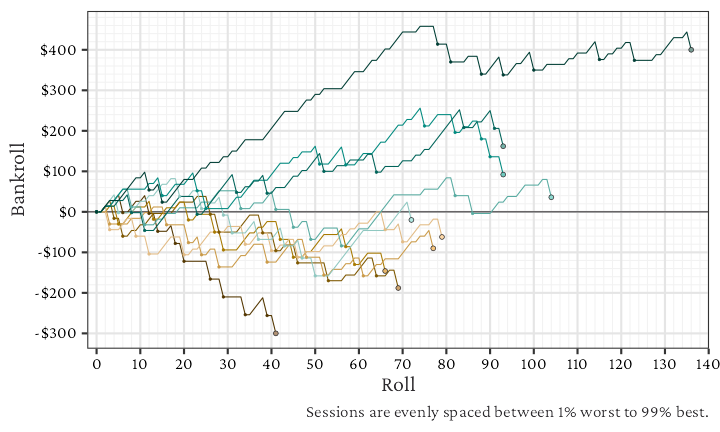
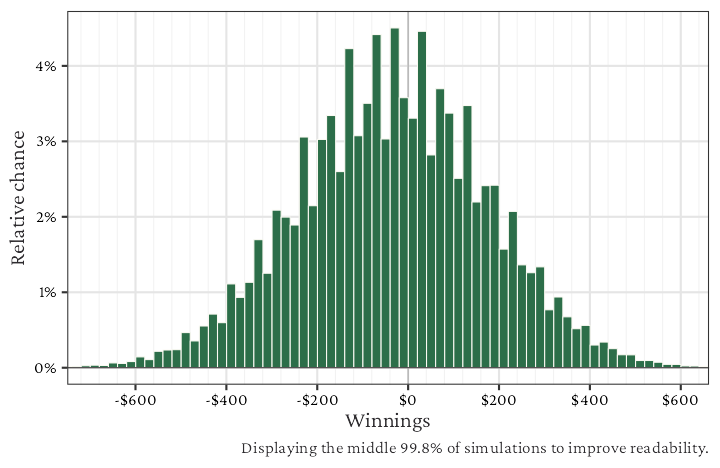
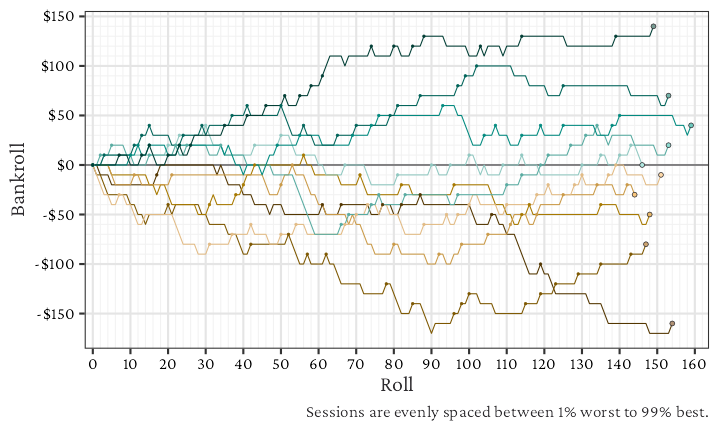
To balance out the higher win chance (consisting of smaller wins), Don’t Pass offers has potentially high downside (large losses). Budgeting for 10 shooters, the worst 1% of sessions is a $140 loss, but the best 1% is only a $90 win. As seen in the sample sessions, the big wins tend to be quicker (fast seven-outs) while the big losses are when several shooters go on long runs of hitting points, which require replacing the don’t pass bet. If instead you play on a time-at-the-table basis, the winnings distribution is much closer to a normal distribution with more balanced high and low sessions (Worst 25% = $50 loss, Best 25% = $40 win).
In terms of variability, the per-shooter variability is about 1.5x that of a $10 coin-flip, which is not surprising given that several $10 bets could happen on one shooter.
The first strategy that most people start with. This one is simple, bet the pass line for $10 and replace it any time the bet is resolved. No odds are included in this page. For a detailed explanation of the pass line bet, see All Bets Are Off: Re-learning the Pass Line Bet in Craps.
Simulated outcomes
To understand how the strategy could perform on any given day, we simulate 1,000,000 sessions for each of three session types: one shooter, 10 shooters, and one hour (144 rolls, letting active bets finish). The results are given in each tab below. For more information on how to read each chart, table, or statistic, see How to interpret statistics from The Craps Analyst.
Analysis
The low house edge of the pass line bet shows up in this strategy, it’s quite reasonable at an average loss of $0.36 per $10 unit per shooter. If a simple strategy like this can keep you entertained, the cost of entertainment is low compared to many other hobbies (but let’s be realistic, few people play only pass line bets, and minimums are often higher than $10).
As with many light-side betting strategies in craps, the pass line strategy has a relatively low win chance, just under 40% per shooter or about 43% per 10 shooters. (Side note, it’s counterintuitive that the win chance goes up with more play. Eventually this number does go down, as I’ve explored in this post: One Surprising Feature of Dark Side Betting).
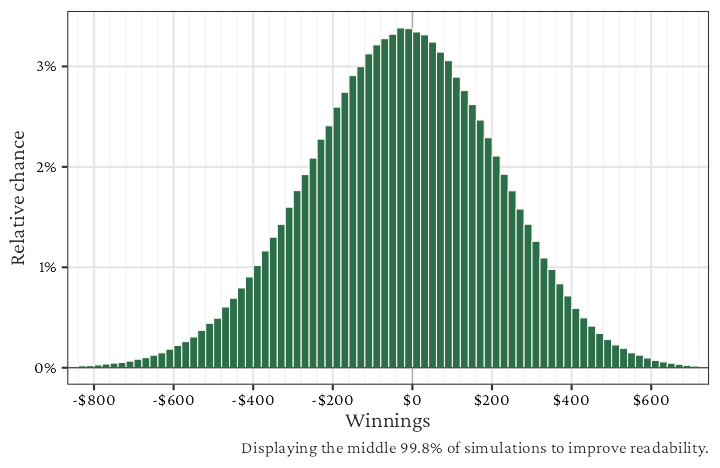
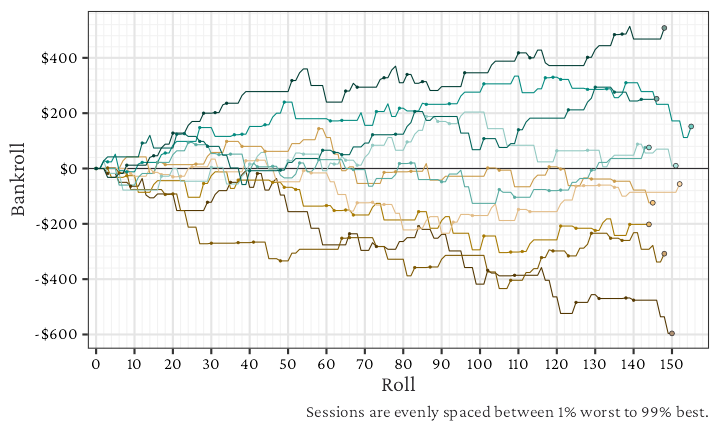
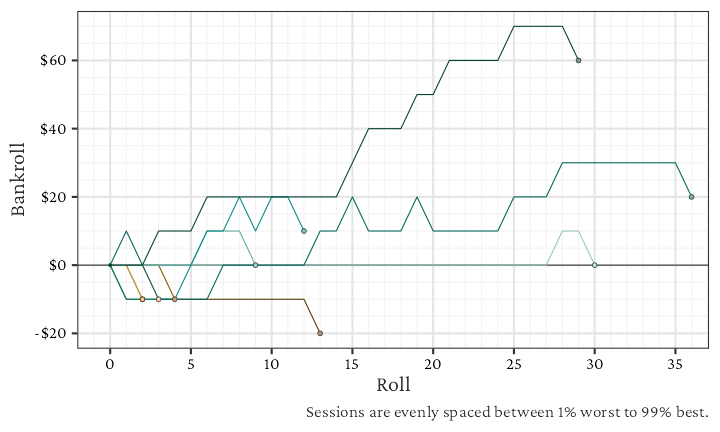
To balance the slightly low win chance, pass line offers the possibility of big wins with lowered downside. Budgeting for 10 shooters, the worst 1% of sessions is a $100 loss, but the best 1% was a $130 win. Even with only 1 shooter, the best 1% of sessions was a $60 win, though eventually the high likelihood seven-outs will catch up to you.
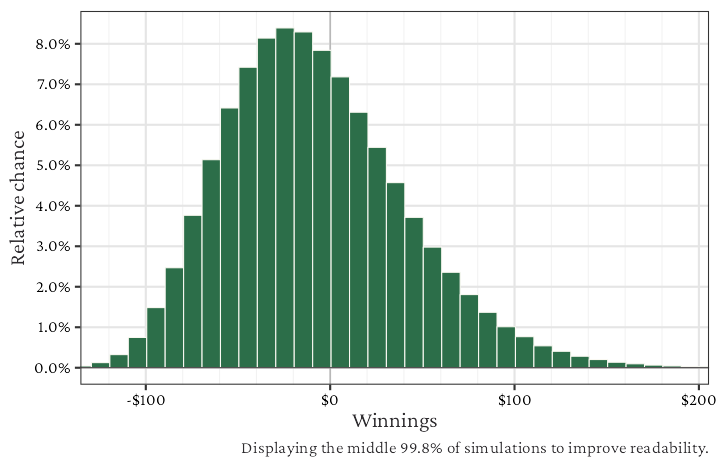
If you play on a time-at-the-table basis, the average loss is $6.18 per hour and the winnings distribution is much closer to a normal distribution. Compared with a per-shooter basis, a few quick seven-outs by the shooters won’t completely stop the session, but the potential losses are not as constrained.
I’ll be honest, I don’t think that I’ve ever played the dark side in craps. To me, the fun is winning with the whole table, enjoying the celebration as a shooter hits one point, then another, and one more for good measure. And even in losing, there is some camaraderie and bonding—at least we’re all miserable together. It builds character.
However, a user of my craps simulator, Eric Brewer, found some head-scratching results as he compared the win percentages for some dark and light side strategies. As we will see, the chance of walking away from the table is higher than 50% under some dark side strategies. This phenomenon has a few downsides, of course, but this is surprisingly different from most pass-line strategies. In this post, we’ll dive deep into this surprising feature of the don’t pass strategy and discover more unexpected results along the way.
First, Some Craps Background
Craps experts—feel free to skip this section, I’m going to describe the key strategies used in this post to make sure everyone is on the same page. Both the pass line (which I’ve done a detailed analysis on here) and don’t pass bets are two-stage bets that are foundational to the game of Craps. They are almost exact opposites:
Phase 1 (when the point if OFF)
Pass line wins on 7, 11; loses on 2, 3, 12
Don’t pass wins on 2, 3; loses on 7, 11; and pushes on 12
any other number (4, 5, 6, 8, 9, 10) sets the point
Phase 2 (when the point is ON)
Pass line wins when the point number is rolled; loses on a 7
Don’t pass wins on a 7; loses when the point is rolled
The wins and losses are all for even money. However, odds bets can be added in Phase 2 (up to a table maximum), which pay the true odds for a respective bet:
Placing odds on pass line pays:
6 to 5 when the point is 6 or 8
3 to 2 when the point is 5 or 9
2 to 1 when the point is 4 or 10
Laying odds on don’t pass pays:
5 to 6 when the point is 6 or 8
2 to 3 when the point is 5 or 9
1 to 2 when the point is 4 or 10
Because the odds bets pay even money, they don’t carry any house edge. The pass line and don’t pass bets have a reasonably small house edge of 1.41% and 1.36% per bet made. Pass line bets have a 2 to 1 advantage of winning in Phase 1 but are at a disadvantage in Phase 2. Because of this, you can’t take a pass line bet down in Phase 2. Don’t pass bets have an advantage in Phase 2, and so casinos will let you take the bet down at any point.
Let’s Test Some Strategies
First, I wanted to get a sense of the difference between the dark side and light side strategies. Eric had done a similar experiment to this as a baseline, which forms the basis of these results. I changed the odds multipliers since I was curious in lower odds tables and adjusted the number of sessions, testing the following strategies:
Pass line bet
Pass line bet with 2x odds
Pass line bet with 345x odds (depending on the point, as is commonly done)
Pass line bet with 10x odds
Don’t pass bet
Don’t pass bet with 2x odds
Don’t pass bet with 345x odds
Don’t pass bet with 10x odds
Each strategy ran for 200,000 sessions, with 10 shooters used per session (this is a common way that people budget their betting, and it is easier to count shooters than to count rolls). I assume a $10 table1 and use a $100K bankroll to ensure that busting won’t be an issue. If there’s a chance that players can bust, the results will be slightly different.
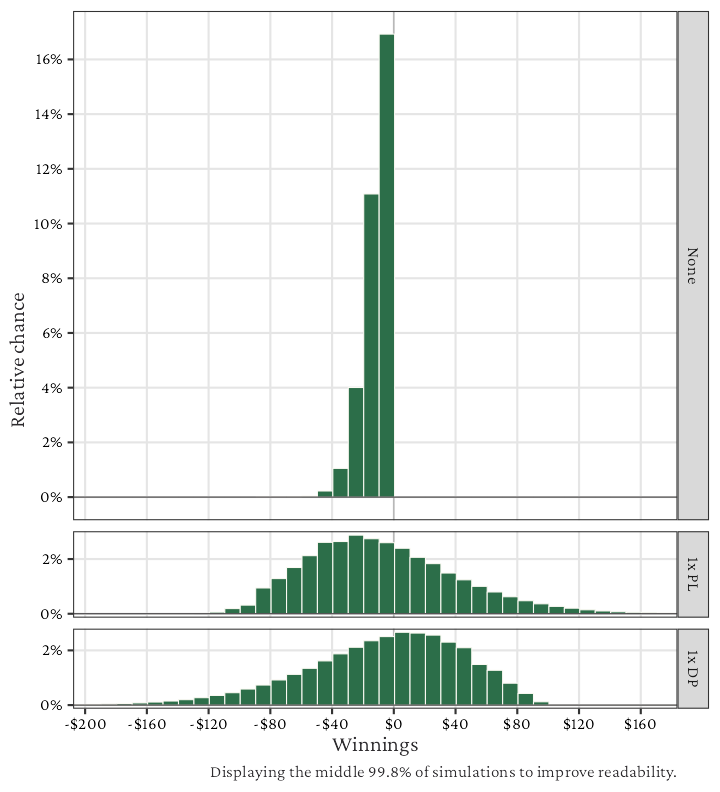
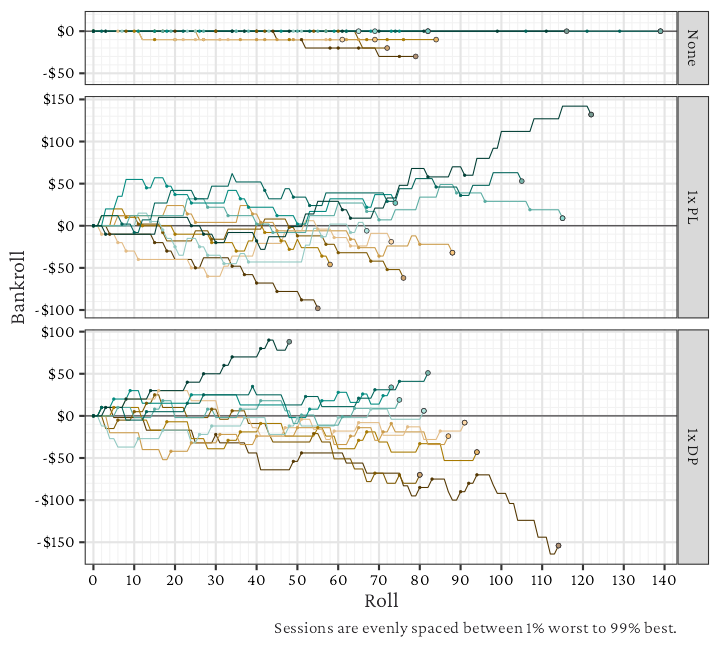
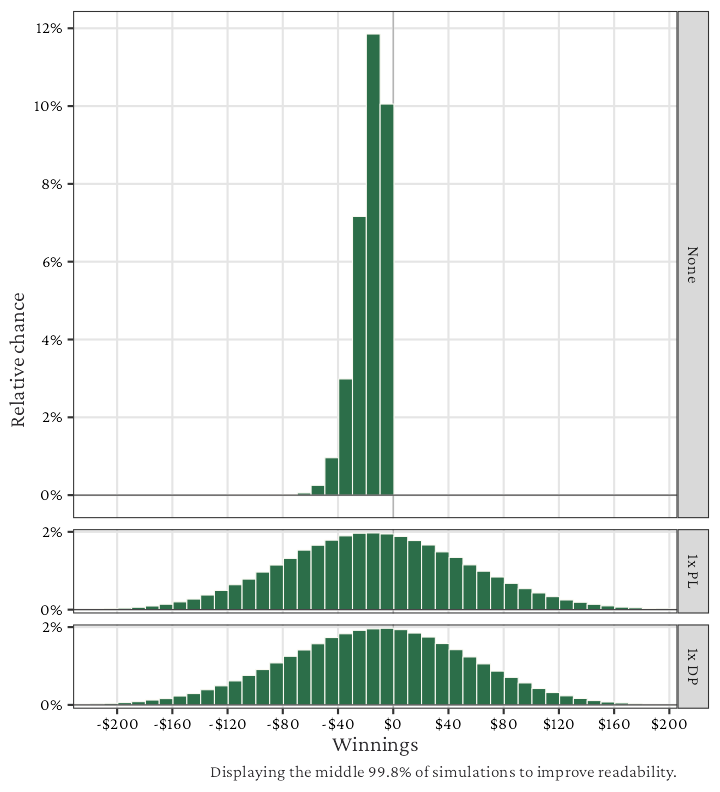
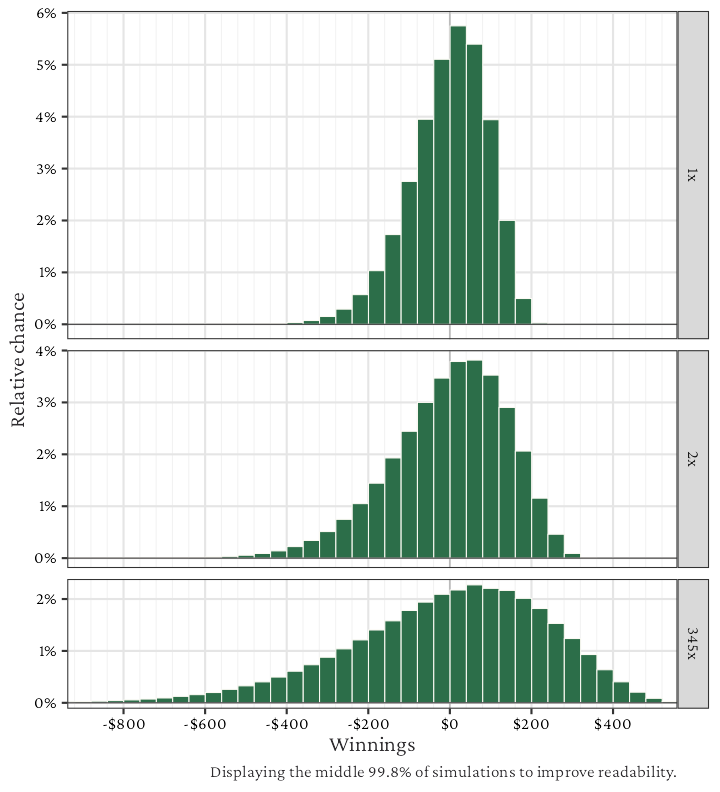
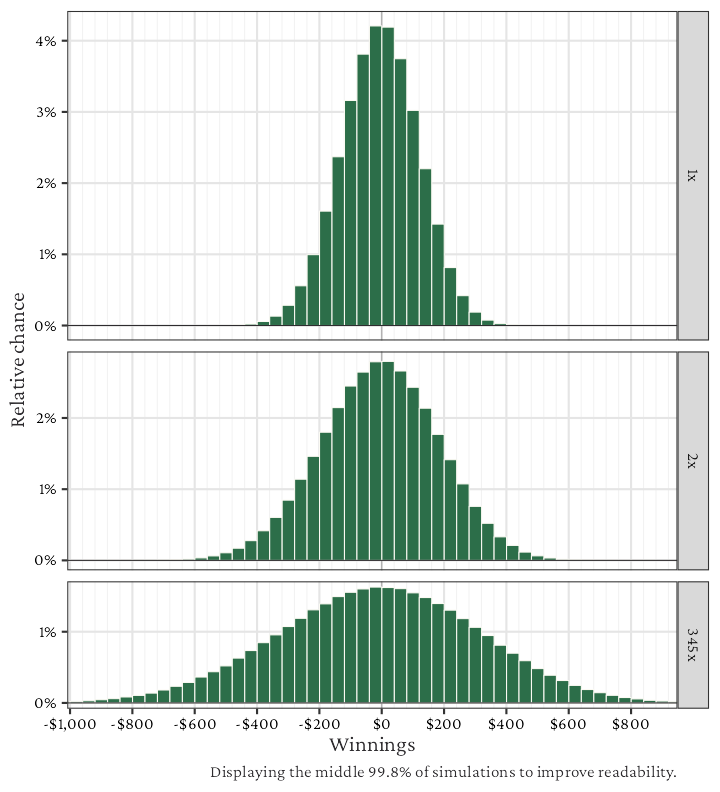
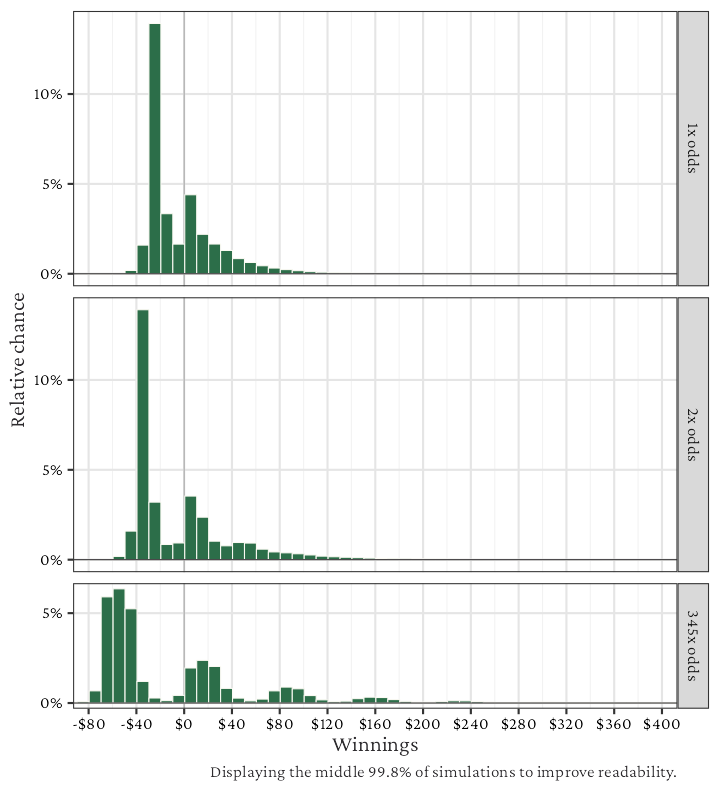
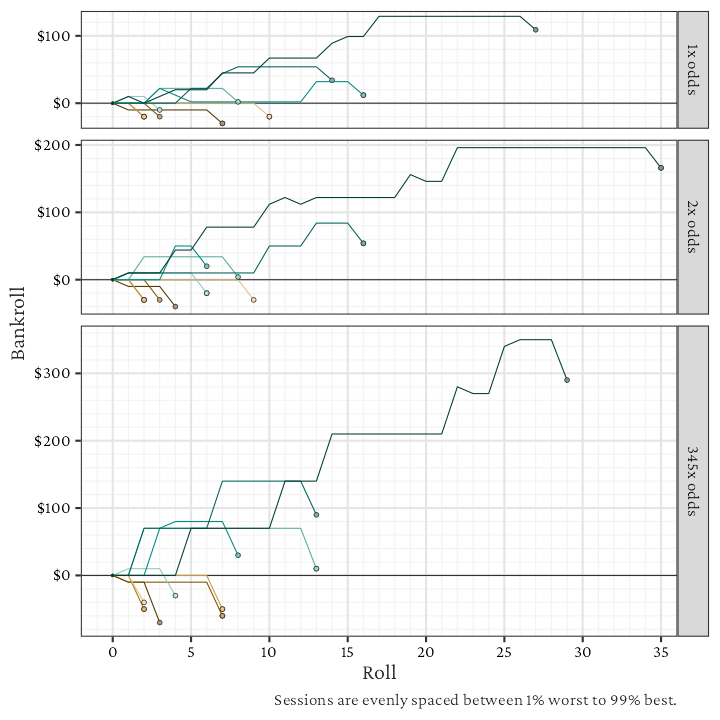
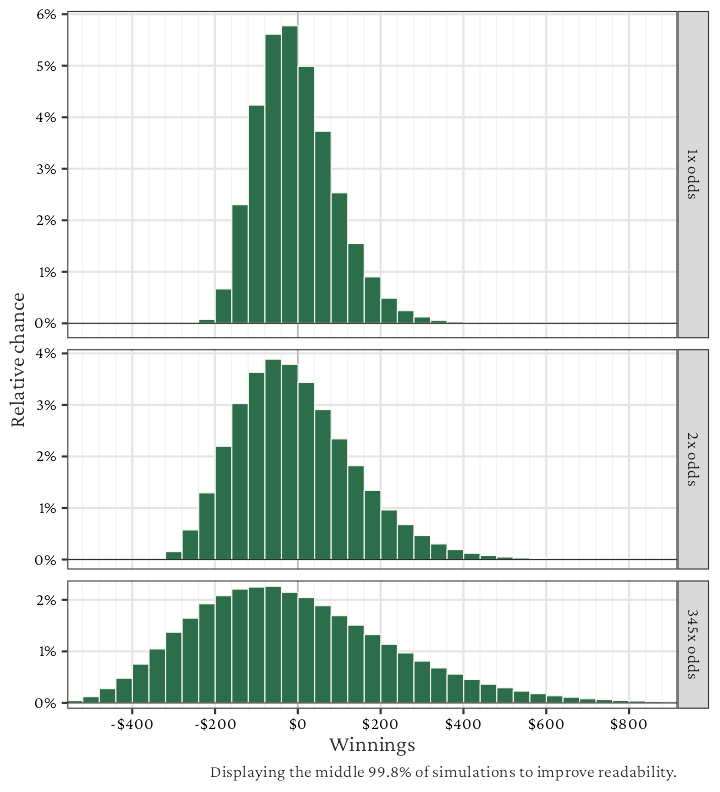
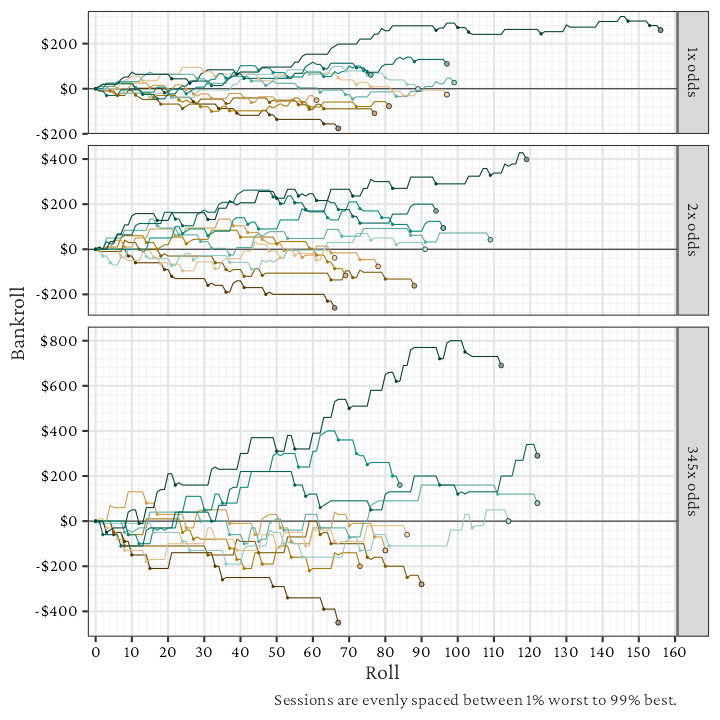
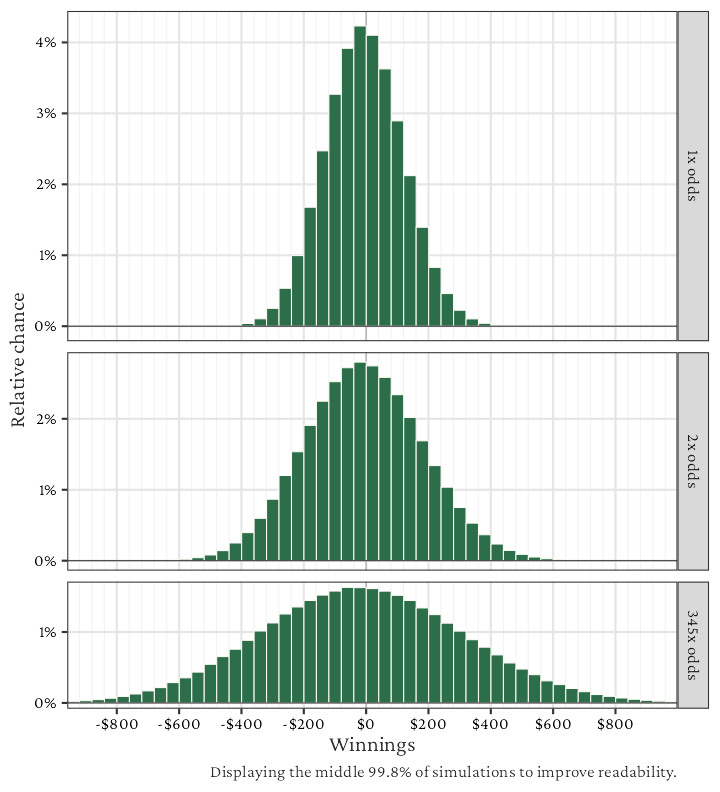
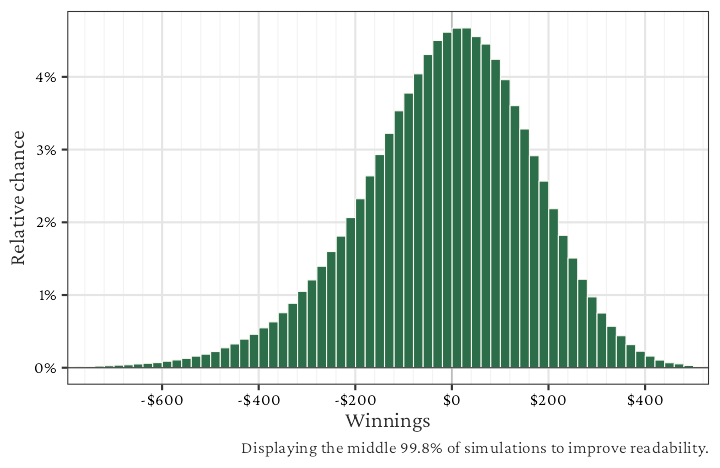
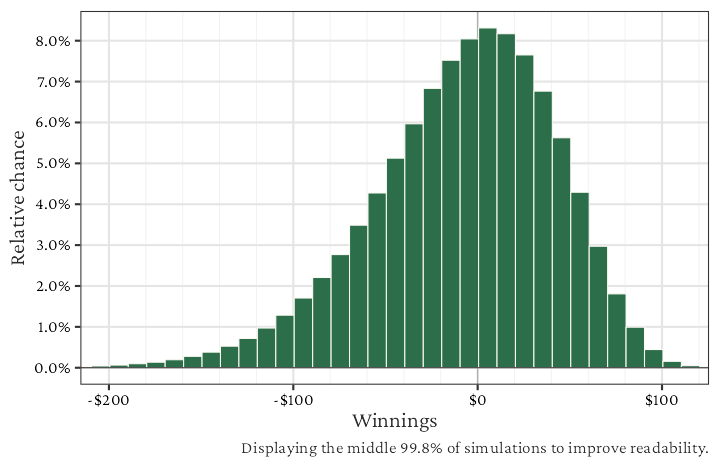
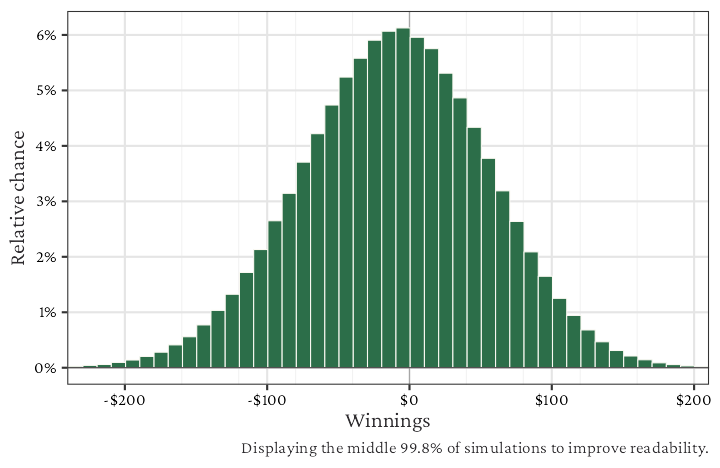
We can understand the range of possible outcomes by looking at the following density plot, which summarizes the 200,000 sessions:
Even without odds, the two bets still can range within a much as a hundred dollars after 10 shooters. Maxing out odds on a 345x table increases the range to nearly $500 on either side. This emphasizes the need for a large bankroll at tables with increasing minimum bet sizes!
But perhaps more interestingly, the dark side and light side bets seem to almost mirror each other in each panel. The pass line has a slightly higher chance of big wins (since the brown line is higher on the far right side), but the don’t pass has a higher chance of more moderate wins. This pattern flips when considering losses: don’t pass has a higher chance for big losses, while the pass line has a higher chance for small losses.
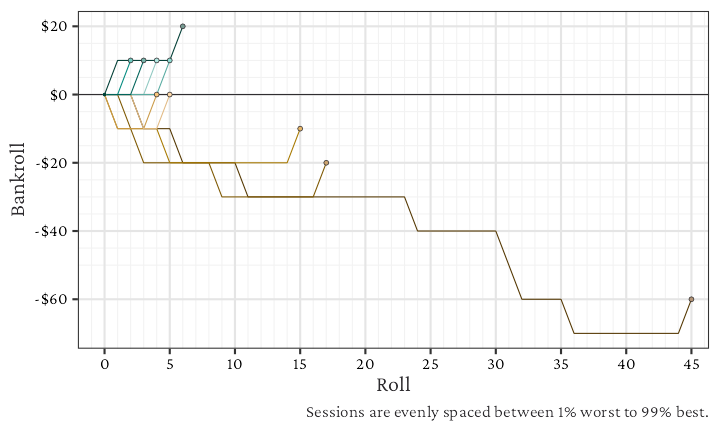
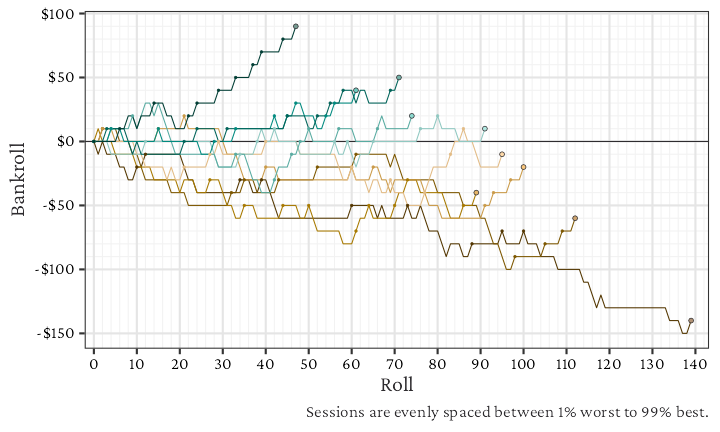
We can take a deeper look through a more traditional boxplot-style visualization:
We let the main box represent the middle 50% of simulations and let the dark bar show the 50% line. This nicely splits an expected session into four regions, each happening 25% of the time: to the left of the main box, in the box but left of the bar, in the box but right of the bar, and right of the main box. We’re all hoping for the sessions to the right of the main box. To explain what happens in the extremes, I use curly braces {,} to denote the region containing 95% of the simulation data. Only 5% of the time would you expect to see a session outside this range.
The boxplots show an interesting trend more succinctly: The don’t pass strategies have winnings over 50% of the time after you add in odds. The dark brown box, representing don’t pass with 345x odds, has a bar above $0, which means that over 50% of the time, you end up with more money than you started! That was shocking to me when Eric contacted me showing this. He wanted to check that there wasn’t a bug in the simulator, and after some further testing, I’m confident the results are a feature of dark side betting.
Why does this happen? I think that after a point is established, the don’t pass bet is likely to win because it will either have 6:5, 3:2, or 2:1 odds in favor of rolling a 7. Placing odds must give you enough to overcome any pre-point losses, where the don’t pass bet is more likely to lose (it’s 2:1 odds that you roll a 7 or 11 loser than a 2, 3, 12 winner). Thus, over 10 sessions, you will likely win on most of the shooters, resulting in an overall win.
Do these results contradict the mantra where “the house always wins”? Not exactly. The house still has an advantage on the don’t pass bets, as we know (it’s 1.36% per bet made). That advantage is marked with the dashed line in the above plot, which we can see is slightly below $0. Even though a don’t pass with odds bettor wins more than 50% of the time on average, when they lose, it has the potential to be very large. So three $40 wins can get erased by a $150 loss, for example. There’s enough of an edge that the casino will win out in the long run with many players.
Betting System
Average Winnings ($)
Low 25% of Winnings ($)
Mid 50% of Winnings ($)
High 75% of Winnings ($)
Chance of winning
Pass line
-3.73
-40.00
-10.00
30.00
43.1%
Pass line (2x odds)
-3.76
-108.00
-20.00
82.00
44.3%
Pass line (345x odds)
-3.68
-180.00
-30.00
140.00
44.8%
Pass line (10x odds)
-5.37
-400.00
-70.00
320.00
45.0%
Don’t Pass
-3.36
-30.00
0.00
30.00
51.4%
Don’t Pass (2x odds)
-3.17
-90.00
12.00
102.00
53.6%
Don’t Pass (345x odds)
-4.15
-150.00
20.00
180.00
53.8%
Don’t Pass (10x odds)
-4.02
-330.00
60.00
390.00
54.4%
The table above gives some hard metrics with these strategies, like the precise win chance and expected edge. For both the dark side and light side the chance of winning increases as the amount of odds increases. While the average winnings vary numerically, the values, in reality, should be constant for the light and dark sides. (I would need to run more simulations to see this, especially for 10x odds strategies, which are very volatile; there is extra volatility here since the number of rolls differs in each session.)
A Deeper Look At Win Percentage
Knowing that the dark side strategies can end up with win percentages over 50%, I wanted to dig deeper and see how far I could push it. I suspected that eventually, if someone stayed at the table long enough, the win percentage would have to drop below 50%. To find out, I set up the following simulation experiment:
Compare 4 strategies:
Pass line bet
Pass line bet with 345x odds
Don’t pass bet
Don’t pass bet with 345x odds
Compare across an increasing number of shooters, from 1 to 100
50,000 sessions simulated for each combination
$15 table, high bankroll
The results are summarized fairly well in the following plots:
Win Percentage
I want to take a quick look at the below plot because it has several surprising and counterintuitive results in it. Each line provided displays the win percentage of the given strategy as we increase the length of the session.
[Side note: win percentage is somewhat tricky to define because of ties. When you walk away with your initial bankroll, some would consider that a win and some a loss—since I want the win percentage + loss percentage to equal 100%, I put half of the ties into each bucket. Counting all ties as wins results in the line given by the upper shaded area, and counting all ties as losses results in the lower shaded area line, in case you want to make those comparisions]
First, look at the green line in the right plot. While the dark side strategy with 345x odds has a decreasing win percentage, it is surprisingly still above 50% even after 75 shooters. A session of 75 shooters is typically between 500 and 700 rolls, or 3-5 hours of play, if not more.
What surprised me more was that for pass line bet with 345x odds, the win percentage first increases as one stays at the table longer. It does flatten out and eventually starts to dip after 100 or so shooters, but it seems extremely counterintuitive that you’re more likely to win if you stay for a few hours than just one.
I’m impressed by how long the strategies using aggressive odds hold on to decent win percentages. We see that not putting down odds results in a win percentage that starts to drop off as the number of shooters increases—by 100 shooters it’s only about 40% for the pass line and 43% for don’t pass.
House Edge
With all this interesting information, it’s important not to forget that the win percentage is only one metric. If we look at the average winnings, i.e. house edge, we can see a familiar pattern:
The longer we stay at the table, the more we lose on average, under all strategies2. The lines on the right plot deviate from the expected straight line because the number of simulations is relatively small, but the trend is clear in both. On average, the don’t pass bets have less house edge, which matches the theoretical quantities.
Volatility
Of course, the longer we stay at the table, the wider range of outcomes we would expect to see. Each box below only shows the middle 50% of the data, so half of the time we end out outside this range. It’s clear how much more risk and reward the strategies with odds have, and so taking advantage of the high win percentages will require substantial bankroll. If not properly bankrolled, we’ve seen in past posts that these volatile strategies can end up with high chances of busting, which is never a fun way to leave the table.
Wrap Up
I have to admit that the analysis here makes the dark side strategies in craps way more interesting to me. We have seen that a don’t pass bet with odds can often keep win percentages above 50% while having a lower house edge than a comparable pass line bet. This high win percentage is also surprisingly robust to large sessions. These nice theoretical features still face my two main drawbacks to the dark side betting:
To have any fun, you must enjoy winning even when everyone else is losing
Dark side betting doesn’t allow for large wins as well as pass line betting does
The first point will vary from person to person. But the second point is important to elaborate on. Many gamblers play for those elusive, huge wins. Anyone that is pressing bets at the table is hoping for a long roll by a shooter which will make them enough money for a great story. That memory is worth something extra to them, and they don’t mind suffering a few losing sessions to get it.
But maybe taking the opposite approach can also increase your fun. Having more winning sessions can feel great, as you’re less likely to walk away from the table a loser. When you do lose, it could be dramatic with a don’t pass bet, and so you have to figure out if those few large losses are worth the increased number of wins.
I hope in the future to explore these two sides and some of the strategies that can skew things in either direction. Strategies like triple lux (where you power press bets hoping for 3 hits on a given number) seem like they will push even more for big wins, at the expense of very low win chances. On the opposite end, anything with a martingale-type approach (i.e. doubling your bets on a loss to try and recover) will skew the other direction: you can push your win percentage up higher but the losing sessions will be devastating. But having both options is what makes craps such an interesting game in my mind—in no other casino game can you have such an influence on the style of winning and losing that occurs.
Disclosures
This blog post is for informational and entertainment purposes only. Any form of gambling carries an inherent risk. Never gamble with money you cannot afford to lose. Anyone who believes they, or someone they know, may have a gambling addiction, please seek help. National Problem Gambling Helpline 1-800-522-4700 Call Text or Chat NCPGambling.org
Endnotes
$10 isn’t a realistic table minimum in all markets these days, but it’s simple to scale up or down. For example, to convert to a $25 table, you can multiply all dollar values by 2.5.↩︎
Also, notice how the two figures have the same scale. Some people claim that adding odds to a pass line bet reduces your house edge. While this is true in terms of percentages, it’s not true in dollar terms. I always like to think of odds as “free variance”, since you get to increase your range of outcomes while not adding any house edge.↩︎
Craps friends, it’s been a while. My craps simulator has been collecting dust (figuratively at least) since July 2019, when I looked into some of the best craps strategies on a budget. The global pandemic hasn’t helped with that either, since I’m unlikely to venture into a casino unless I can be elbow-to-elbow with other players. Craps is more fun that way in my opinion.
For this post, I put 5 systems through my simulator and spent some time crunching the numbers. What we’ll see is that each strategy has unique features—though some have significant drawbacks and make it hard to walk away as a winner. There are also a few surprises about strategy evaluation depending on how you budget for the table. Let’s dive in.
The 5 Craps Systems
For completeness, I’ll summarize the 5 systems here briefly. The systems are based on a $5 table (which I realize are hard to find these days) but can be scaled up appropriately for higher table minimums.
Iron Cross
With Iron Cross, you will win some money on each dice roll, except for a seven, once a point is established.
$5 pass line bet with 2x odds
$5 field bet (while the point is ON)
$10 place bet on 5
$12 place bet on 6 and 8
If the point is a 5, 6, or 8, skip the place bet on that number
Hammerlock
I think the idea here is to capitalize on medium-length rolls from a shooter. You hope to sneak in a few place bet wins before ultimately hoping for a 7-out.
$5 pass line bet
$5 don’t pass bet, with a lay of $30 in odds
A phased place bet approach (no matter what the point is):
Start with $12 place bet each on 6 and 8
If one of these bets wins, shift to $22 inside (place the 5, 6, 8, and 9)
If one of the inside bets wins, take all place bets down
Risk 12 (A.k.a. A Strategy For Low Rollers)
Like the name suggests, this system only risks $12 on each shooter but offers some potential to make money on a hot roll.
Before a point is established:
$5 pass line
$5 field bet
After a point is established:
$6 place bet on 6 and 8, if you have winnings from the pre-point phase:
Generally, if the point is 4/9/10, you can take your field winnings plus $2 for the place bets
If the point is 5/6/8, you lost in the field, but if you had won on some combinations of earlier rolls (2, 12, 11) you might have enough to add one or both of the place bets.
I omitted the suggestion of risking the extra $2 on some prop bets (i.e. hard 6, hard 8) when you don’t have enough to place them.
Knockout
This one is pretty simple, as described it’s basically a “doey-don’t” before the point and max odds behind the pass line
$5 pass line
$5 don’t pass
3-4-5x odds behind the pass line bet
Dice Doctor (A.k.a. “The Best” Craps System)
Want to try your luck on the field? That’s essentially the idea for Dice Doctor’s system:
You are doubling on every other win, and moving slowly higher otherwise. After a field loss (which happens 55% of the time), you return to $10.
Let’s Simulate
With the systems rigorously described, I was able to pass them through my python simulator to mimic the results of 200,000 sessions at the craps table. It’s not easy to come up with a perfect comparison, so I decided on letting each session finish after 20 shooters had gone at the table. This corresponds to between 133 and 211 rolls 80% of the time but ranged from 68 to 369 rolls across the 200,000 sessions. The average shooter had about 8.5 rolls.
Each session’s craps table has 1 player following each of the systems and follows a few reasonable table assumptions. Since the systems are designed for different budgets, each player has a budget corresponding to what Best Craps Strategy suggested:
Betting System
Budget
Iron Cross
$540
Hammerlock
$600
Risk 12
$120
Knockout
$250
Dice Doctor
$500
These budgets follow a common approach that guarantees enough bankroll for 10 shooters. Thus, the systems with higher bankrolls are the ones making more bets on the table for each shooter. Budgets play a key role in determining which system is right for you, and the 10 shooter measure provides a reasonable comparison.
The Results Are In
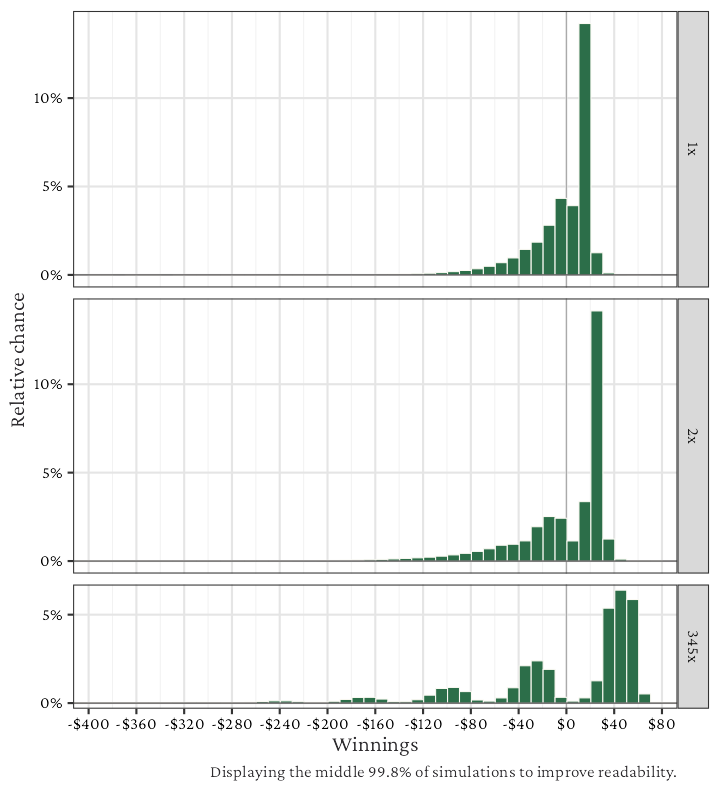
200,000 sessions fly by in about 1 hour of CPU time, and we can take a look at the range of outcomes that each system had. The plot below shows the winnings (final cash – initial bankroll) after the 20 shooters. The height gives a sense of the relative chance of each outcome happening for a given system.
A couple of things jump out right away. Most strategies show a spike on the low end of their winnings, which corresponds to “busting out” with no money left. Different strategies have different peak heights, which gives a sense of the chance of busting. With different budgets, these peaks would change, and with an unlimited budget, we wouldn’t see them at all.
The systems also show significant differences in the range of outcomes (statisticians call this variance). The Risk 12system displays the smallest outcome range, and it is well contained between -$120 and $200. Iron Cross and Dice Doctor have a wide range of outcomes, and they even had occasions where they won as much as $2000 (you have to move the plot over to see it).
By the way, the plot above is interactive. You can click on a strategy in the legend to omit it from the comparison. Hover over an outline to remind you which strategy is which. You can also click and drag to zoom in on a region of interest or reset the view with the “home” button at the top.
In More Detail
We can take a more extensive look at each strategy with some hard metrics. I calculate these measures on a $/hour basis by using the rule-of-thumb that 144 rolls roughly correspond to an hour at the craps table, which I’ve used in previous posts.
Average winnings are similar to the house edge. The Low 25%, Mid 50%, and High 75% of winnings give you a sense of what is likely to happen in any given session. 25% of the time you will fall below the Low, 25% of the time you will fall between Low and Mid, another 25% for between Mid and High, and the luckiest 25% of sessions will be above the High.
Betting System
Average Winnings ($/hour)
Low 25% of Winnings ($/hour)
Mid 50% of Winnings ($/hour)
High 75% of Winnings ($/hour)
Hammerlock
-10.46
-81.29
-13.02
57.80
Risk 12
-20.04
-63.36
-17.89
23.92
Knockout
-23.17
-104.52
-16.00
64.42
Dice Doctor
-69.99
-213.18
-80.50
59.02
Iron Cross
-70.13
-196.11
-50.44
77.23
This table gives some additional context to the plot. We see that Iron Cross and Dice Doctor have a tremendous house edge of $70 per hour. While they also have some of the highest potential winnings, that house edge is way more than I am ever willing to give away on a $5 table. Plus, this assumes the field has a number that pays triple, and it only gets worse if that is not true.
Hammerlock, Risk 12, and Knockout show a much lower house edge, and in-fact the High 75% for Hammerlock and Knockout at pretty close to the Iron Cross and Dice Doctor. This reveals that their upsides are comparable at that level, while you do much better in the average session.
Risk 12, unsurprisingly, has a much narrower range of potential winnings and losses. This is a conservative strategy, which has a time and place for the budget player. However, it’s important to point out that, on average, Risk 12 has higher losses than Hammerlock. So the narrow range comes at some price for the average session.
Looking at the data in a slightly different way, we can see what these metrics look like in $/20 shooters, i.e. $/session. The below table shows those measures, along with the chance of busting and the chance of walking away with any winnings.
Betting System
Average Winnings ($/20 shooters)
Low 25% of Winnings ($/20 shooters)
High 75% of Winnings ($/20 shooters)
Chance of Busting (%)
Chance of Any Winnings (%)
Knockout
-7.03
-110.00
85.00
4.62%
44.29%
Risk 12
-14.00
-67.00
31.00
12.18%
38.56%
Hammerlock
-17.91
-98.00
65.00
0.00%
44.85%
Iron Cross
-41.92
-204.00
101.00
0.84%
39.75%
Dice Doctor
-70.23
-240.00
70.00
3.44%
34.29%
Take another look at the difference between the two tables. The ordering in terms of average winnings changed! In all honesty, I am still not 100% sure what causes this. One reason the metrics differ is that each session has a varying number of rolls, and typically longer rolls are per shooter are better for the systems (except Hammerlock). So looking on a per roll basis, and knowing that it corresponds to exactly 20 shooters, provides some information that may bias the first table. Think about the Knockout strategy; if there were many rolls, then I know the shooters probably were making some points, making the player money. I think this second table is more representative in this case because the number of shooters is what each simulation was restricted to.
Are you more likely to join the table for a fixed time or a fixed number of shooters? This may affect how you budget and choose from relevant strategies. For example, the results from this post apply if you are more likely to play with a fixed number of shooters. The data here would suggest that Knockout has the smallest losses during that session, but not necessarily the lowest losses per roll, among the given systems.
Another metric to consider is the chance of walking away with any winnings. This is simply the percentage of sessions where your ending bankroll is larger than your initial bankroll. For Knockout and Hammerlock, this number is relatively high at 44-45%. However, the other strategies range from 34% to 40%. I think this metric is important to factor in because it shows how often you can walk away feeling good with the session.
Hot Table Or Cold Table?
Most craps players intuitively know that in a given session, someone playing the pass line is going to have almost the opposite luck as someone playing the don’t pass. For the most part, one of those players will walk away as a winner and the other a loser, because the payouts are almost inverted (don’t forget the push on 12 for the don’t pass). But if you play the pass line with odds and your friend plays a place 6/8 strategy, how often do you both end up as winners? or losers?
This notion is formalized statistically as correlation, which measures how similar two things are under identical conditions. Since the results of the simulations were all from the same 200,000 table sessions, I’m able to look at the correlation among the 5 systems.
A correlation close to 1 indicates nearly identical winnings—if you won $100, your friend won close to $100. A correlation close to 0 suggests the strategies aren’t similar, and we can’t tell what your friend won based on your winnings. On the other side, correlations can be close to -1 and suggest that if your friend won, you probably lost. For example, the pass line and don’t pass strategies probably have a correlation close to -1.
The plot above shows the correlation between the 5 systems. Take the top row as an example. Hammerlock has a correlation of 1 with itself (this always happens), but it negatively correlated with the other 4 systems. Hammerlock and Knockout have a correlation of -0.67, which likely comes from one relying on winning the pass odds and the other wanting to win the lay odds. Hammerlock does well on a cold table while Knockout does well with a few hot shooters.
Some of the systems show high correlation, such as Iron Cross vs Knockout (correlation = 0.78) and Risk 12 vs Iron Cross(correlation = 0.74). These three strategies all rely on a pass line bet and do poorly when the shooter 7-outs.
Unsurprisingly, the Dice Doctor strategy shows the lowest correlation with any other strategies. The correlation ranges from 0.09 to 0.22 because the field bet is so different from the pass line, don’t pass, and place bets. The strongest correlation is with Iron Cross, which also features frequent field betting.
Takeaways
There’s a lot of information in this post, but I still feel like we have only scratched the surface in analyzing craps systems. The 5 systems described highlight a variety of different bets and offer a little bit for everyone. Here are a few things that I took away from this analysis:
Systems involving pass line, don’t pass, place 6/8, and odds bets generally show a lower house edge while still offering a range of outcomes.
You need to tailor a system to your budget, since some can get quite expensive and require a large bankroll (i.e. Iron Cross, Dice Doctor).
Evaluating systems can depend strongly on whether your budget is on a “per shooter” or a “per time” basis.
If you enjoy winning while others are winning, you want to pick a strategy that is highly correlated to typical player strategies that “go with the table”.
Disclosures
For transparency, the folks at Best Craps Strategy provided funding for my time to perform this analysis and write the results. I understand that they are genuinely interested in improving their growing site with good craps information, and will use this information to expand their systems page. I don’t make any money if you check out their site. Links from their site have been removed in this updated version.
This blog post is for informational and entertainment purposes only. Any form of gambling carries an inherent risk. Never gamble with money you cannot afford to lose. Anyone who believes they, or someone they know, may have a gambling addiction, please seek help. National Problem Gambling Helpline 1-800-522-4700 Call Text or Chat NCPGambling.org
Table Assumptions
I make the following assumption for the simulations in this post:
The minimum bet on the table is $5
3-4-5x odds are allowed on pass line bets. This means you can put 3x your pass line bet if the point is 4 or 10, 4x if the point is 5 or 9, and 5x if the point is 6 or 8. This also means you can put 6x your don’t pass bet in odds to receive 3-4-5x the bet if you win.
For field bets, you get paid double on 2 and triple on 12. Some casinos only pay double on 2 and 12, which would increase the house edge for systems using field bets.
Players strictly stick to their systems!
For the Dice Doctor system, I won’t continue to increase the progression beyond the $75, $150 portion, the player just continues to go back and forth between $75 and $150 if they keep winning. This happens very rarely, even over 200,000 table sessions.