We all hope for the insanely long rolls on a craps table—if someone can hold the dice and toss them 50 times, most light-side strategies are going to rake in a huge haul of chips.
But how often will a given shooter will have a 50-roll session? Conversely, how often will they seven-out right after setting a point? And what about every situation in between?
In this post, we’ll look at how many rolls each shooter will have and try to build some intuition about how to think about this properly. For the hardcore numbers people, we’ll even throw a bit of math in at the end to allow you to do these calculations yourself.
Rolls per craps shooter
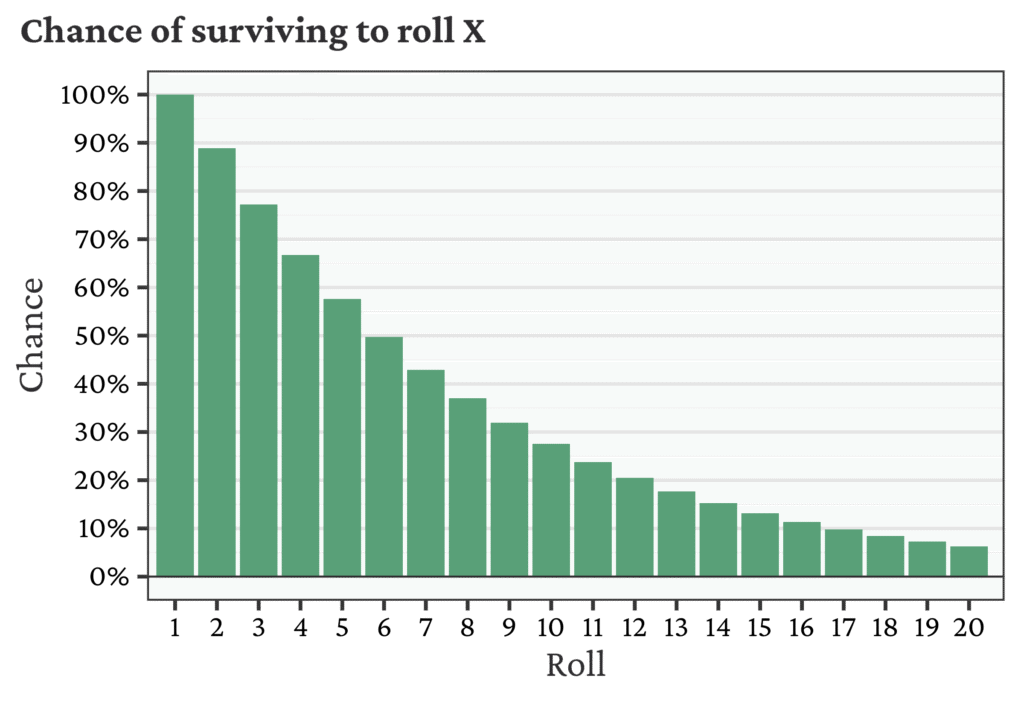
Because the number of rolls is random, there are a few different ways we can think about it. Maybe the simplest place to start is with the chance of surviving to roll X. For example, with a new shooter, what’s the chance we would make it to the 10th roll? The bar chart below shows this chance for the first 20 rolls.
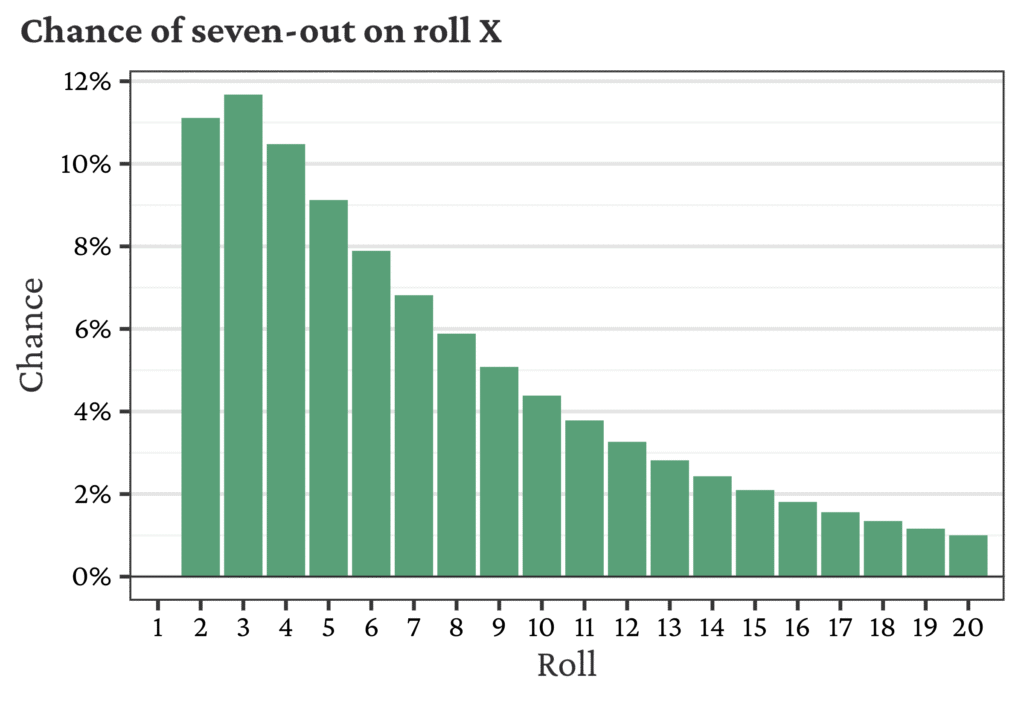
The difference between two subsequent bars (roll X–1, X) gives the chance of the player sevening out (on roll X). It’s impossible to seven-out on the first roll, but after that, the chance of a seven-out on roll X is provided for the first 20 rolls below.
The mean (average) number of rolls is 8.53. However, the number of rolls is skewed to the right, so the mean is a bit higher than the point at which the survival probability drops below 50% (called the median). The median number of rolls is 6. For planning, the median is more reliable and interpretable: about half the time, you will see 6 or fewer rolls, and the other half, you will see 7 or more rolls.
All of the above probabilities assume we start from roll 0. What about if we are in the middle of a roll? The probabilities assume the roll is in the come-out (point OFF), but otherwise are memoryless. So, for example, if the shooter has just made a point and is back in the come-out, then the chance of surviving ANOTHER X roll(s) is identical to the chance of surviving TO roll X, i.e., we can pull from the first bar chart. The same is true for the chance to seven-out.
For reference, the values are provided in the table below for up to 50 rolls.
| Roll | Chance of surviving another X roll(s) | Chance of seven-out in the next X roll(s) |
|---|---|---|
| 1 | 100.00% | 0.00% |
| 2 | 88.89% | 11.11% |
| 3 | 77.21% | 11.68% |
| 4 | 66.74% | 10.48% |
| 5 | 57.61% | 9.12% |
| 6 | 49.72% | 7.89% |
| 7 | 42.90% | 6.82% |
| 8 | 37.02% | 5.89% |
| 9 | 31.94% | 5.08% |
| 10 | 27.55% | 4.38% |
| 11 | 23.77% | 3.78% |
| 12 | 20.51% | 3.26% |
| 13 | 17.69% | 2.82% |
| 14 | 15.26% | 2.43% |
| 15 | 13.16% | 2.10% |
| 16 | 11.35% | 1.81% |
| 17 | 9.79% | 1.56% |
| 18 | 8.45% | 1.35% |
| 19 | 7.29% | 1.16% |
| 20 | 6.28% | 1.00% |
| 21 | 5.42% | 0.86% |
| 22 | 4.67% | 0.75% |
| 23 | 4.03% | 0.64% |
| 24 | 3.48% | 0.55% |
| 25 | 3.00% | 0.48% |
| 26 | 2.59% | 0.41% |
| 27 | 2.23% | 0.36% |
| 28 | 1.92% | 0.31% |
| 29 | 1.66% | 0.26% |
| 30 | 1.43% | 0.23% |
| 31 | 1.23% | 0.20% |
| 32 | 1.06% | 0.17% |
| 33 | 0.92% | 0.15% |
| 34 | 0.79% | 0.13% |
| 35 | 0.68% | 0.11% |
| 36 | 0.59% | 0.09% |
| 37 | 0.51% | 0.08% |
| 38 | 0.44% | 0.07% |
| 39 | 0.38% | 0.06% |
| 40 | 0.33% | 0.05% |
| 41 | 0.28% | 0.04% |
| 42 | 0.24% | 0.04% |
| 43 | 0.21% | 0.03% |
| 44 | 0.18% | 0.03% |
| 45 | 0.16% | 0.02% |
| 46 | 0.13% | 0.02% |
| 47 | 0.12% | 0.02% |
| 48 | 0.10% | 0.02% |
| 49 | 0.09% | 0.01% |
| 50 | 0.07% | 0.01% |
But what if a point is set? The chance of a seven-out in the next roll is 6/36 = 16.67%, translating to an 83.33% chance of surviving another roll, so we can immediately see the probabilities are different. This situation, and the come-out situation, are fully calculated and shown in the table below for up to 50 rolls. It’s a bit counterintuitive why the point number matters—but for roll 2, there’s a chance the previous roll made the point and thus returns to the come-out state where a seven-out is impossible. Thus, the chance of surviving is slightly higher for points that are more likely to be made (i.e., 6 or 8).
| Roll | Chance of surviving another X roll(s) | Chance of seven-out in the next X roll(s) | ||||
|---|---|---|---|---|---|---|
| Point 4 or 10 | Point 5 or 9 | Point 6 or 8 | Point 4 or 10 | Point 5 or 9 | Point 6 or 8 | |
| 1 | 83.33% | 83.33% | 83.33% | 16.67% | 16.67% | 16.67% |
| 2 | 70.83% | 71.30% | 71.76% | 12.50% | 12.04% | 11.57% |
| 3 | 60.53% | 61.37% | 62.18% | 10.30% | 9.93% | 9.58% |
| 4 | 51.83% | 52.90% | 53.90% | 8.70% | 8.47% | 8.28% |
| 5 | 44.44% | 45.62% | 46.70% | 7.40% | 7.28% | 7.20% |
| 6 | 38.13% | 39.35% | 40.43% | 6.31% | 6.27% | 6.27% |
| 7 | 32.74% | 33.94% | 34.98% | 5.39% | 5.41% | 5.45% |
| 8 | 28.13% | 29.28% | 30.25% | 4.61% | 4.66% | 4.73% |
| 9 | 24.18% | 25.26% | 26.15% | 3.95% | 4.02% | 4.10% |
| 10 | 20.80% | 21.79% | 22.60% | 3.38% | 3.47% | 3.55% |
| 11 | 17.90% | 18.80% | 19.52% | 2.90% | 2.99% | 3.08% |
| 12 | 15.40% | 16.22% | 16.86% | 2.49% | 2.58% | 2.66% |
| 13 | 13.26% | 13.99% | 14.55% | 2.14% | 2.23% | 2.30% |
| 14 | 11.42% | 12.07% | 12.56% | 1.84% | 1.92% | 1.99% |
| 15 | 9.84% | 10.41% | 10.84% | 1.58% | 1.66% | 1.72% |
| 16 | 8.47% | 8.98% | 9.36% | 1.36% | 1.43% | 1.49% |
| 17 | 7.30% | 7.75% | 8.08% | 1.17% | 1.23% | 1.28% |
| 18 | 6.29% | 6.68% | 6.97% | 1.01% | 1.06% | 1.11% |
| 19 | 5.42% | 5.77% | 6.01% | 0.87% | 0.92% | 0.96% |
| 20 | 4.67% | 4.97% | 5.19% | 0.75% | 0.79% | 0.83% |
| 21 | 4.03% | 4.29% | 4.47% | 0.64% | 0.68% | 0.71% |
| 22 | 3.47% | 3.70% | 3.86% | 0.56% | 0.59% | 0.61% |
| 23 | 2.99% | 3.19% | 3.33% | 0.48% | 0.51% | 0.53% |
| 24 | 2.58% | 2.75% | 2.87% | 0.41% | 0.44% | 0.46% |
| 25 | 2.23% | 2.38% | 2.48% | 0.36% | 0.38% | 0.39% |
| 26 | 1.92% | 2.05% | 2.14% | 0.31% | 0.33% | 0.34% |
| 27 | 1.66% | 1.77% | 1.84% | 0.26% | 0.28% | 0.29% |
| 28 | 1.43% | 1.52% | 1.59% | 0.23% | 0.24% | 0.25% |
| 29 | 1.23% | 1.31% | 1.37% | 0.20% | 0.21% | 0.22% |
| 30 | 1.06% | 1.13% | 1.18% | 0.17% | 0.18% | 0.19% |
| 31 | 0.92% | 0.98% | 1.02% | 0.15% | 0.16% | 0.16% |
| 32 | 0.79% | 0.84% | 0.88% | 0.13% | 0.13% | 0.14% |
| 33 | 0.68% | 0.73% | 0.76% | 0.11% | 0.12% | 0.12% |
| 34 | 0.59% | 0.63% | 0.65% | 0.09% | 0.10% | 0.10% |
| 35 | 0.51% | 0.54% | 0.56% | 0.08% | 0.09% | 0.09% |
| 36 | 0.44% | 0.47% | 0.49% | 0.07% | 0.07% | 0.08% |
| 37 | 0.38% | 0.40% | 0.42% | 0.06% | 0.06% | 0.07% |
| 38 | 0.32% | 0.35% | 0.36% | 0.05% | 0.06% | 0.06% |
| 39 | 0.28% | 0.30% | 0.31% | 0.04% | 0.05% | 0.05% |
| 40 | 0.24% | 0.26% | 0.27% | 0.04% | 0.04% | 0.04% |
| 41 | 0.21% | 0.22% | 0.23% | 0.03% | 0.04% | 0.04% |
| 42 | 0.18% | 0.19% | 0.20% | 0.03% | 0.03% | 0.03% |
| 43 | 0.16% | 0.17% | 0.17% | 0.02% | 0.03% | 0.03% |
| 44 | 0.13% | 0.14% | 0.15% | 0.02% | 0.02% | 0.02% |
| 45 | 0.12% | 0.12% | 0.13% | 0.02% | 0.02% | 0.02% |
| 46 | 0.10% | 0.11% | 0.11% | 0.02% | 0.02% | 0.02% |
| 47 | 0.09% | 0.09% | 0.10% | 0.01% | 0.01% | 0.02% |
| 48 | 0.07% | 0.08% | 0.08% | 0.01% | 0.01% | 0.01% |
| 49 | 0.06% | 0.07% | 0.07% | 0.01% | 0.01% | 0.01% |
| 50 | 0.06% | 0.06% | 0.06% | 0.01% | 0.01% | 0.01% |
Curious to learn how to calculate these probabilities? The next sections focus on all of the mathematical details, starting piece by piece.
Starting small: building intuition
Each session, per shooter, consists of a few different situations. We start with the point OFF during the come-out rolls. Then, if a point is set, the shooter can either seven-out (ending their turn) or hit the point (returning to the point OFF situation). This cycle can continue on and on, but eventually the shooter will seven-out.
The total number of rolls can be found by adding up
- the number of rolls they had for the come-out, plus
- the number of rolls while the point was ON, plus
- if hitting the point,
- the number of rolls on the next come-out, plus
- the number of rolls while the point was ON, plus
- if hitting the next point,
- the number of rolls on the next, next come-out plus
- …
You can see the pattern forming, and the recursive, repeating nature makes the calculation a bit challenging. Fortunately, we can easily figure out the number of rolls in the two defined situations: 1) during the come-out and 2) during the point.
Number of come-out rolls
When the point is OFF, the shooter can end the come-out by setting a point (rolling a 4, 5, 6, 8, 9, or 10). Any other roll (2, 3, 7, 11, or 12) will keep them in the come-out. The chance of setting a point is 24/36 or 66.7% (check this yourself by adding up the dice probabilities), and the chance of staying in the come-out is 12/36 or 33.3%.
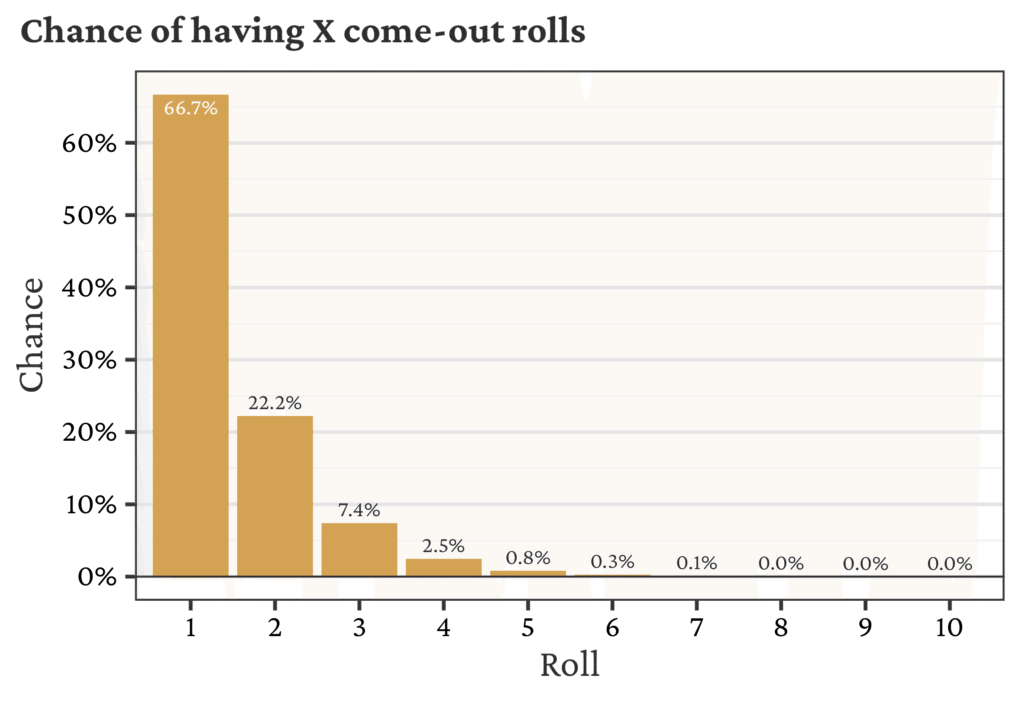
To build some intuition, let’s calculate the chance of having 1, 2, or 3 come-out rolls:
- 1 come-out roll means the shooter set a point on the first roll, which we showed above has a probability of 24/36 = 66.7%
- 2 come-out rolls mean the shooter didn’t set a point on their first roll, and then set a point on the second roll. The probability is then calculated as (12/36)×(24/36) = 22.2%
- 3 come-out rolls happen from 1) no point set, 2) no point set, 3) point set. The probability is then calculated as (12/36)×(12/36)×(24/36) = 7.4%
We can continue this pattern and build out full probabilities in the bar chart below. This pattern is known as a Geometric Distribution, specifically Geometric(p=24/36). The mean number of rolls is 1.5, the median is 1, and the mode (most likely) is also 1.
Number of rolls for a given point
Once a point is set, the intuition and setup for figuring out the number of rolls while this point is ON follows the same pattern as for the come-out, just with different underlying chances.
Say the point is 6
- Combined, the chance to end the given point state is 11/36 = 30.6%
- Chance to seven-out and end the roll is 6/36 = 16.7%
- Chance to hit point and return to come-out is 5/36 = 13.9%
- Chance to stay with current point: 25/36 = 69.4%
Then the logic from come-out rolls follows exactly, replacing 24/36 with 11/36 and replacing 12/36 with 25/36. (Note that the chance to end this type of roll is much lower, so we expect more rolls in total.) If the point is 4 or 10, the chance to end the point is 10/36 = 27.8% (the chance to stay is 26/36). If the point is 5 or 9, the chance to end the point is 9/36 = 25% (the chance to stay is 27/36).
Thus, we have the following depending on the point:
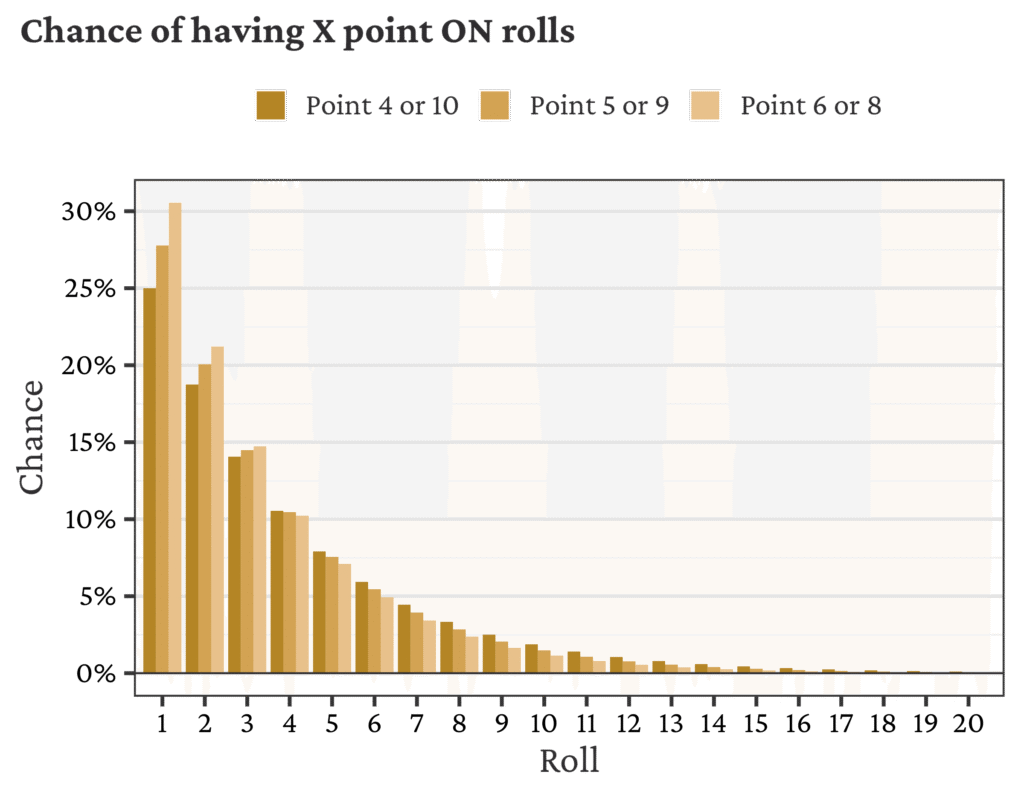
- The number of rolls when the point is 6 or 8 is Geometric(p=11/36). So mean = 3.27 and median = 2.
- The number of rolls when the point is 5 or 9 is Geometric(p=10/36). So mean = 3.60 and median = 3.
- The number of rolls when the point is 4 or 10 is Geometric(p=9/36). So mean = 4.00 and median = 3.
The pattern for these probabilities is given in the bar chart below.
Altogether: calculating the total number of rolls
The unfortunate mathematical detail is that we can’t directly combine these geometric distributions nicely. Instead, to calculate the total number of rolls, we’ll need a slightly more nuanced approach.
The trick is to consider the possible states of a roll and how likely a transition is to each other state. The possible states of a session are
- Come-out (when Point OFF), denoted Co
- Point ON 6 or 8, denoted O6,8
- Point ON 5 or 9, denoted O5,9
- Point ON 4 or 10, denoted O4,10
The probability of each transition, including to a seven-out which ends the roll, is given in the diagram below. For example, Come-out transitions to Point ON 6 or 8 with probability 10/36 (5 ways to roll 6, 5 ways to roll 8), which transitions back to the come-out with probability 5/36 (5 ways to roll the point, whether it’s 6 or 8). The transition probability from Point ON to a seven-out is always 6/36. Note also that the probability of staying in a given state corresponds to the geometric distribution parameters from the earlier sections.
Given the above diagram, we can calculate the probability of being in state Y on roll r, denoted \(P_r(Y)\), based on the probability of being in any state on roll \(r-1\) times the probability of the transition. Essentially, we look at all of the arrows pointing into a given state.
Simplifying to matrix form, we get
Then this recursive formulation can be used to calculate the probability of being in the four states after \(r\) rolls (from the come-out) by taking the initial state (\(r=0\)) as (1, 0, 0, 0) and computing:
And finally, the sum of all state probabilities (not being a seven out) \(P_r(\text{C}_o) + P_r(\text{O}_{6,8}) + P_r(\text{O}_{5,9}) + P_r(\text{O}_{4,10}) \) is equal to the probability of surviving another \(r\) rolls, as required.
The probability of surviving another r rolls from the Point ON 6 or 8 state uses a similar calculation but replaces (1, 0, 0, 0) with (0, 1, 0, 0), and so on for the other points.
That wraps up the major math calculations, and now you have all the tools to figure out how many rolls to expect for each shooter. You could even figure out how lucky this potentially record-setting 153-roll session was.
Full credit and thanks to Michael Shackleford (and BruceZ), where I first saw this solution for the total number of rolls.