A strategy designed to win on any roll that’s not a seven, once a point is established:
Bet the pass line for $10
Add 2x odds when the point is on
Place the 5 for $20 (two units)
Place the 6 and 8 for $24 each (two units)
If the point is 5, 6, or 8, skip the place bet on that number
Bet the field for $10 (when the point is on)
Simulated outcomes
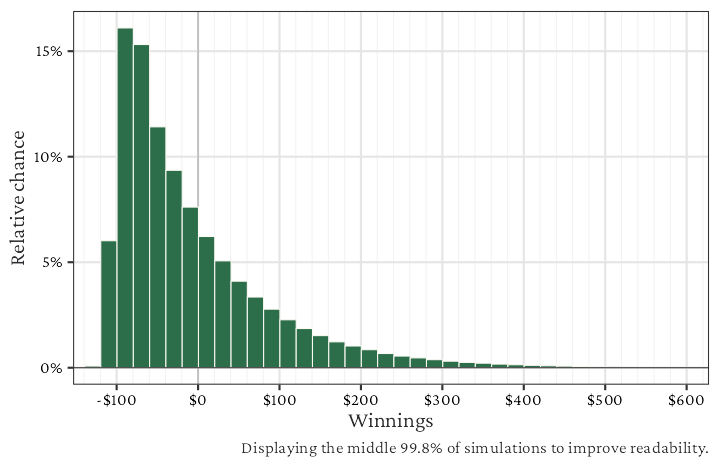
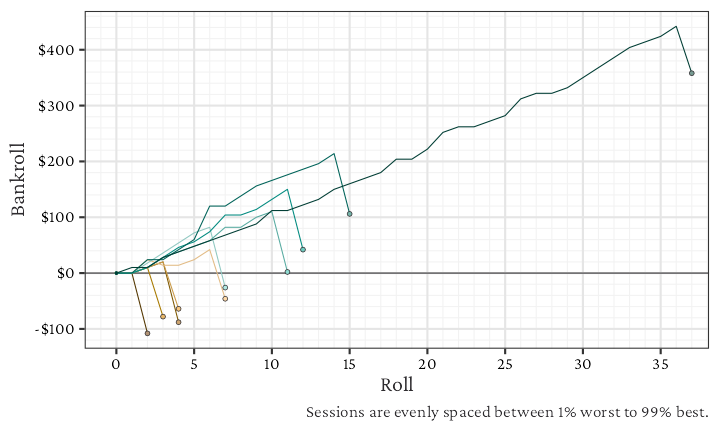
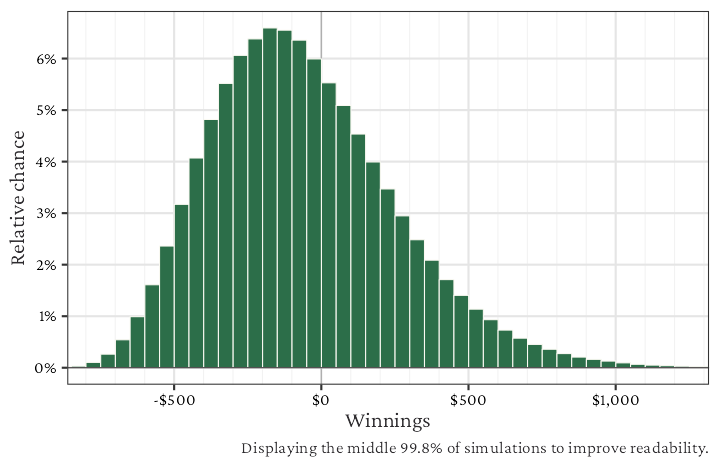
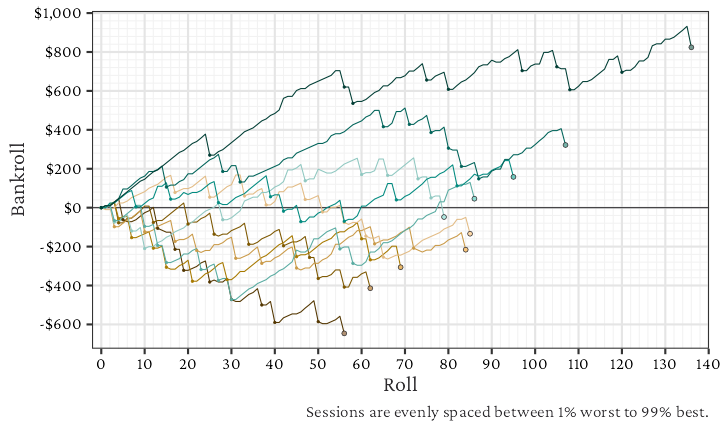
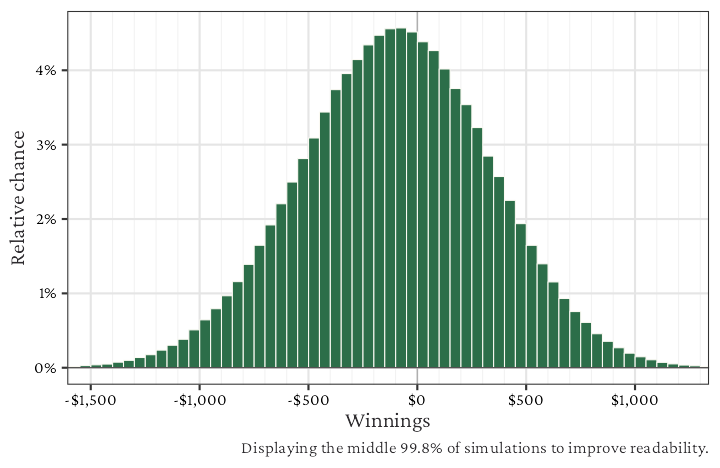
To understand how the strategy could perform on any given day, we simulate 1,000,000 sessions for each of three session types: one shooter, 10 shooters, and one hour (144 rolls, letting active bets finish). The results are given in each tab below. For more information on how to read each chart, table, or statistic, see How to interpret statistics from The Craps Analyst.
Analysis
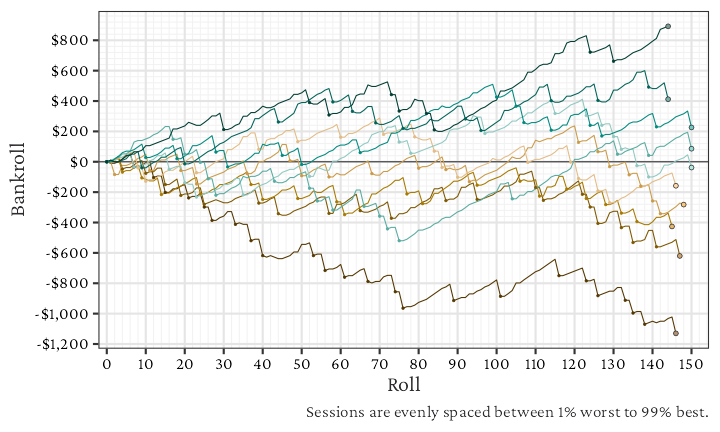
The Iron Cross is designed to win on any number that isn’t a seven (when the point is on), and we can see this behavior in the per-shooter example session lines—the bankroll increases each roll until a seven-out, at which point the player loses the full outlay (up to $108 with a $10 unit). The amount won on non-seven rolls will vary (and depends on the point set), for example a 3 or 11 rolled only wins $10 on the field, but hitting a point of 4 would win $60 ($10 pass line, $40 odds, $10 field).
Because there is a lot of betting, the average loss is very high at $5.91 per shooter, $58.42 per 10 shooters, and $101.51 per hour. For per-10-shooter sessions, this average loss is over 16x a Pass Line strategy with the same betting unit. For the same reason, there is a lot of variability compared to other strategies with only one bet.
When budgeting per-shooter, the quantiles and histogram indicate that the strategy can very likely result in moderate losses but also carry potential for huge wins. The losses are capped, but one seven wipes out the entire outlay; players are hoping for a long roll to build up the winnings before that happens. It’s also worth noting that the middle 50% of winnings (thought of as an average session in some sense) has losses much worse than the average winnings (-$36 vs -$5.91 for one shooter; -$92 vs -$58.42 for ten shooters). This typically means your average session is going to feel worse than the edge from the combined bets dictates, and overall you’re hoping for a huge win in the top 10-20% of luck or better.