Strategy description
The first strategy that most people start with. This one is simple, bet the pass line for $10 and replace it any time the bet is resolved. No odds are included in this page. For a detailed explanation of the pass line bet, see All Bets Are Off: Re-learning the Pass Line Bet in Craps.
Simulated outcomes
To understand how the strategy could perform on any given day, we simulate 1,000,000 sessions for each of three session types: one shooter, 10 shooters, and one hour (144 rolls, letting active bets finish). The results are given in each tab below. For more information on how to read each chart, table, or statistic, see How to interpret statistics from The Craps Analyst.
Analysis
The low house edge of the pass line bet shows up in this strategy, it’s quite reasonable at an average loss of $0.36 per $10 unit per shooter. If a simple strategy like this can keep you entertained, the cost of entertainment is low compared to many other hobbies (but let’s be realistic, few people play only pass line bets, and minimums are often higher than $10).
As with many light-side betting strategies in craps, the pass line strategy has a relatively low win chance, just under 40% per shooter or about 43% per 10 shooters. (Side note, it’s counterintuitive that the win chance goes up with more play. Eventually this number does go down, as I’ve explored in this post: One Surprising Feature of Dark Side Betting).
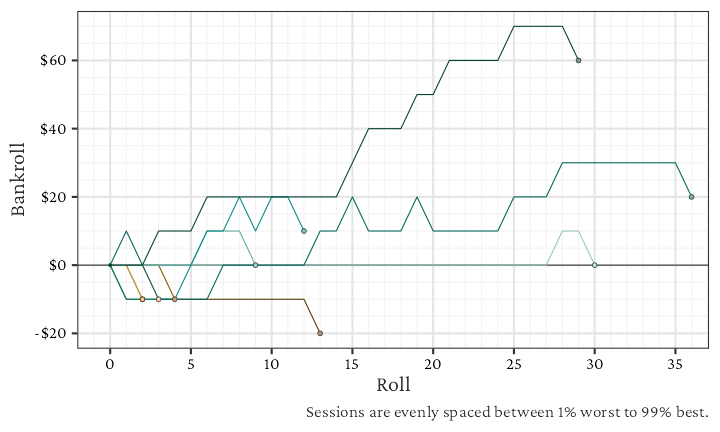
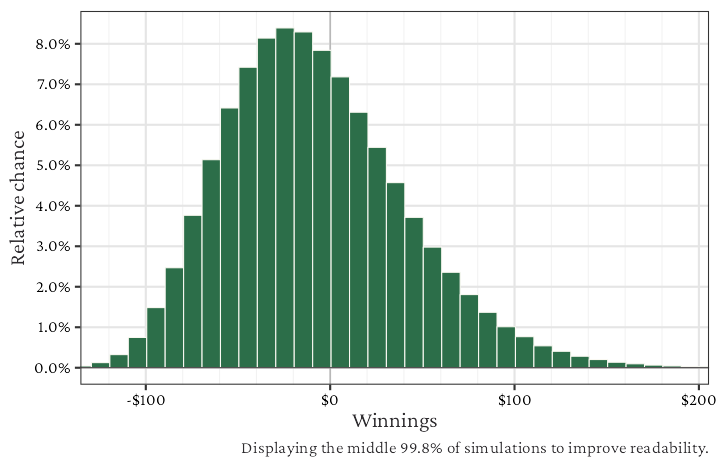
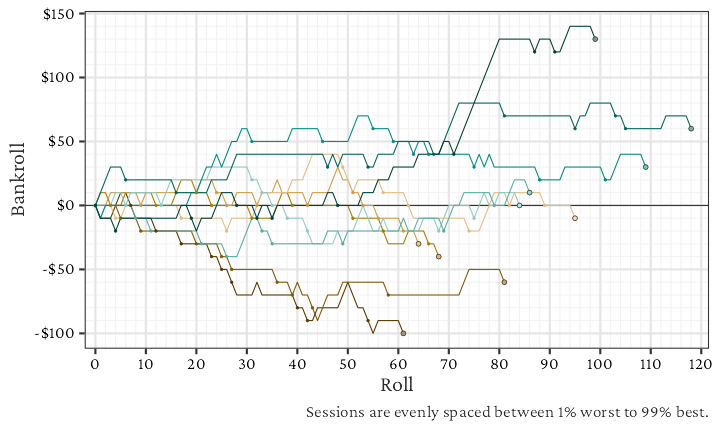
To balance the slightly low win chance, pass line offers the possibility of big wins with lowered downside. Budgeting for 10 shooters, the worst 1% of sessions is a $100 loss, but the best 1% was a $130 win. Even with only 1 shooter, the best 1% of sessions was a $60 win, though eventually the high likelihood seven-outs will catch up to you.
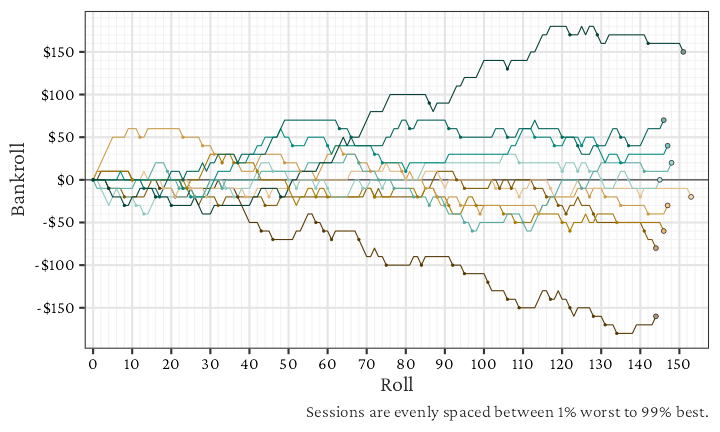
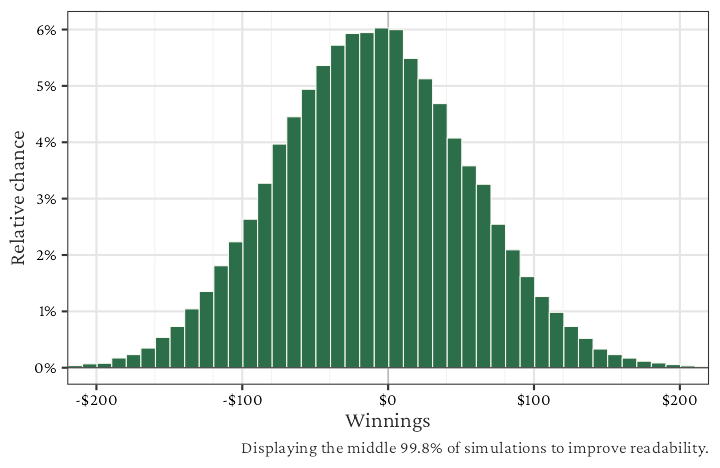
If you play on a time-at-the-table basis, the average loss is $6.18 per hour and the winnings distribution is much closer to a normal distribution. Compared with a per-shooter basis, a few quick seven-outs by the shooters won’t completely stop the session, but the potential losses are not as constrained.
- Per shooter
- Per 10 shooters
- Per hour
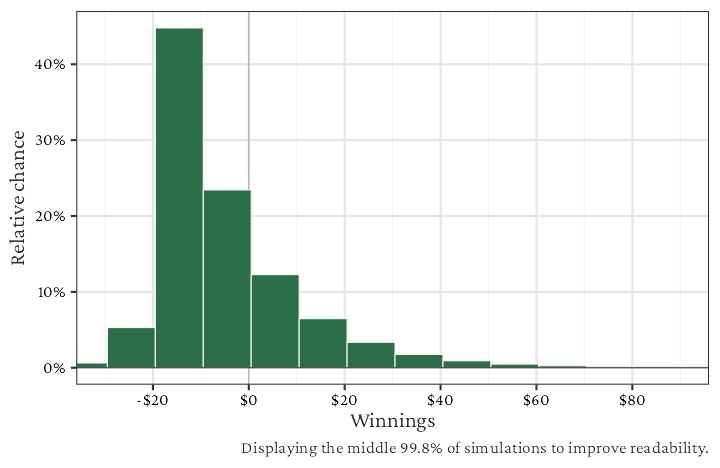
Per shooter
Strategy metrics
| Average Winnings | Win Chance | Variability |
|---|---|---|
| −$0.36 | 37.5% | $15.68 |
Session quantiles
| Worst 1% | Worst 25% | Mid 50% | Best 25% | Best 1% |
|---|---|---|---|---|
| −$20.00 | −$10.00 | −$10.00 | $10.00 | $60.00 |
Resulting winnings after each simulated session
Sample of 10 sessions
Per 10 shooters
Strategy metrics
| Average Winnings | Win Chance | Variability |
|---|---|---|
| −$3.56 | 43.3% | $49.55 |
Session quantiles
| Worst 1% | Worst 25% | Mid 50% | Best 25% | Best 1% |
|---|---|---|---|---|
| −$100.00 | −$40.00 | −$10.00 | $30.00 | $130.00 |
Resulting winnings after each simulated session
Sample of 10 sessions
Per hour
Strategy metrics
| Average Winnings | Win Chance | Variability |
|---|---|---|
| −$6.18 | 46.0% | $65.51 |
Session quantiles
| Worst 1% | Worst 25% | Mid 50% | Best 25% | Best 1% |
|---|---|---|---|---|
| −$160.00 | −$50.00 | −$10.00 | $40.00 | $150.00 |
Resulting winnings after each simulated session
Sample of 10 sessions